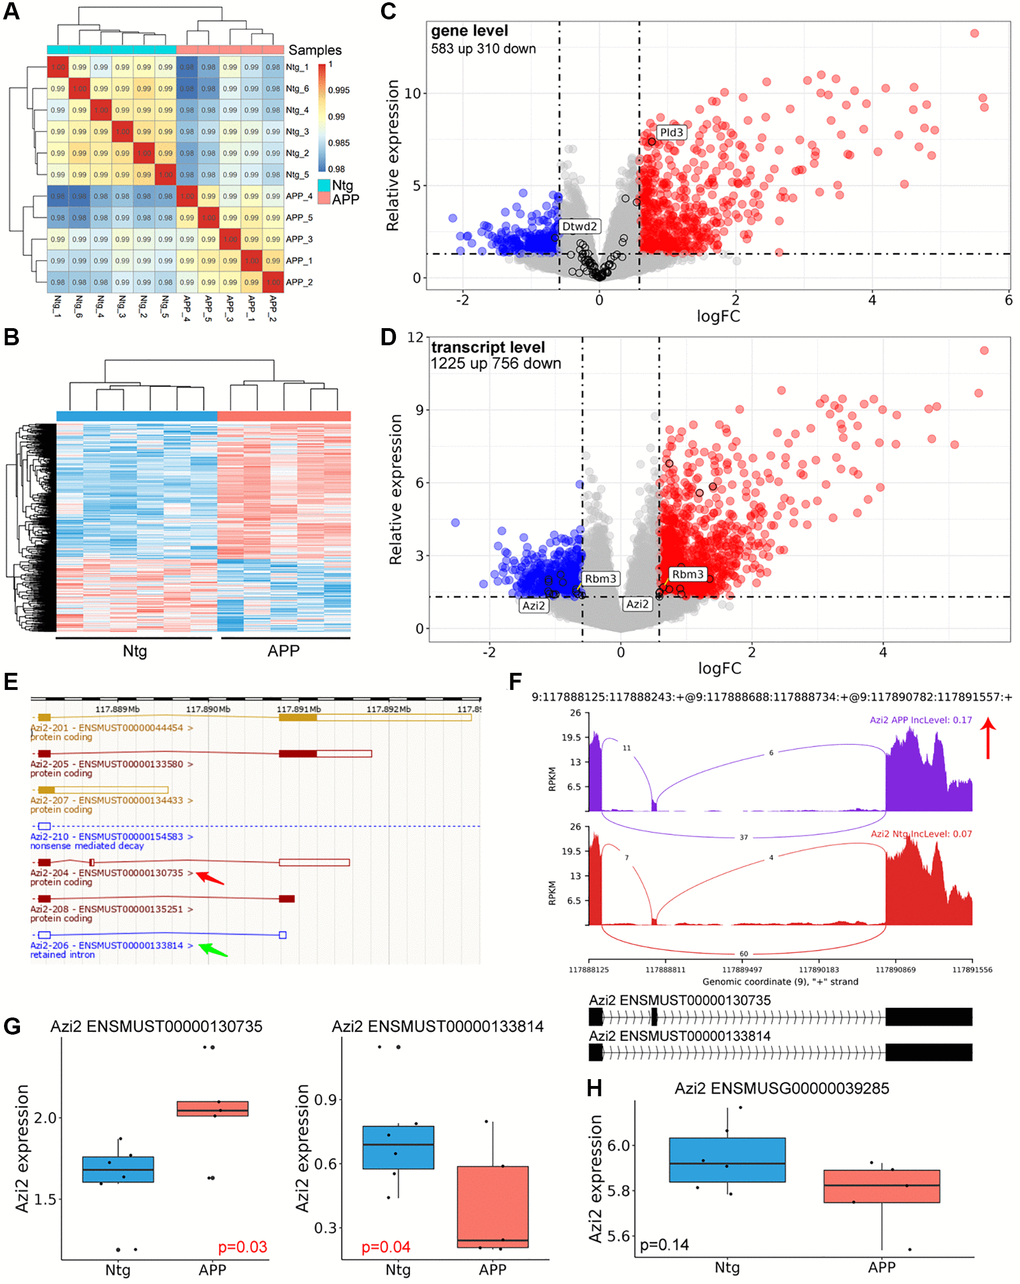
Figure 5.Differentially genes and transcripts analysis. (A) Correlation analysis with gene expression matrix. (B) Heatmap of dysregulated genes between APP and Ntg group. (C) Volcano plot of dysregulated genes. The black circle indicated genes with significant AS event. (D) Volcano plot of dysregulated transcripts. Genes harbored different transcripts with opposite changes were labeled. (E) Genomic information of Azi2. Red arrow indicated the longer transcript with coding ability and SE event, and the green arrow revealed the shorter transcript with RI. (F) The detailed sashimi plots for Azi2. (G, H) Relative expression of Azi2 in gene and transcript levels. ENSMUST00000130735 represented longer Azi2 transcript, and ENSMUST00000133814 represented the shorter transcript.