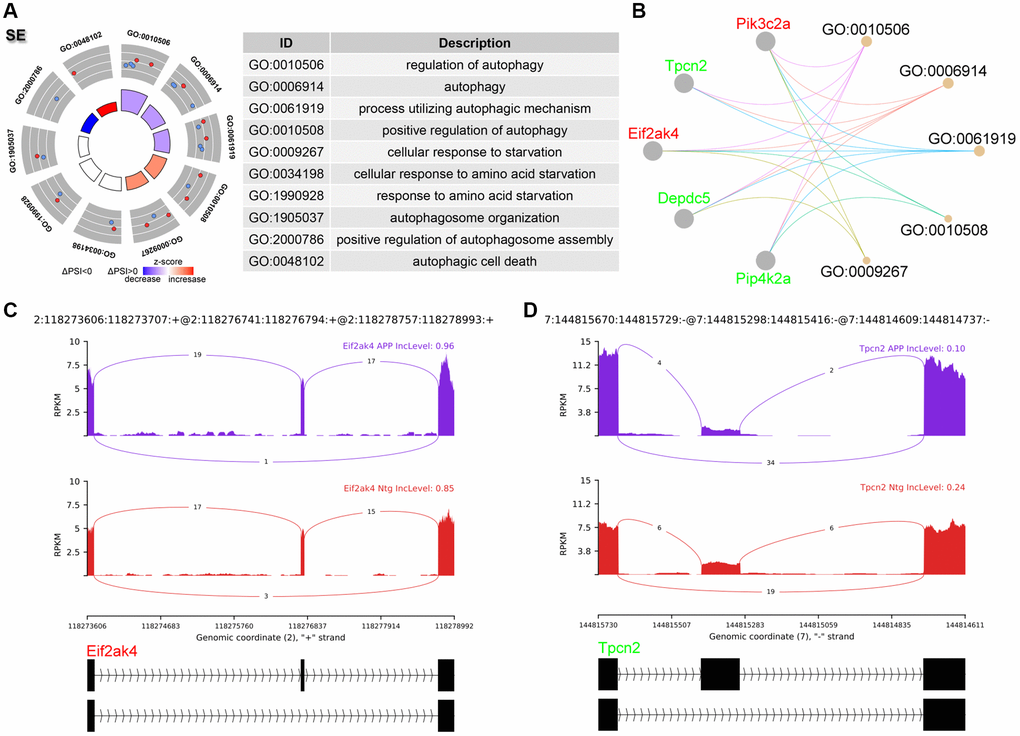
Figure 2.Analysis of SE events. (A) Significant GO terms enriched in genes involved in SE events. (B) Cnetplot revealed genes in these enriched GO terms. Eif2ak4 colored in red indicated increased PSI level, while Tpcn2 colored in green represented decreased PSI level. (C, D) The detailed sashimi plots for Eif2ak4 and Tpcn2.