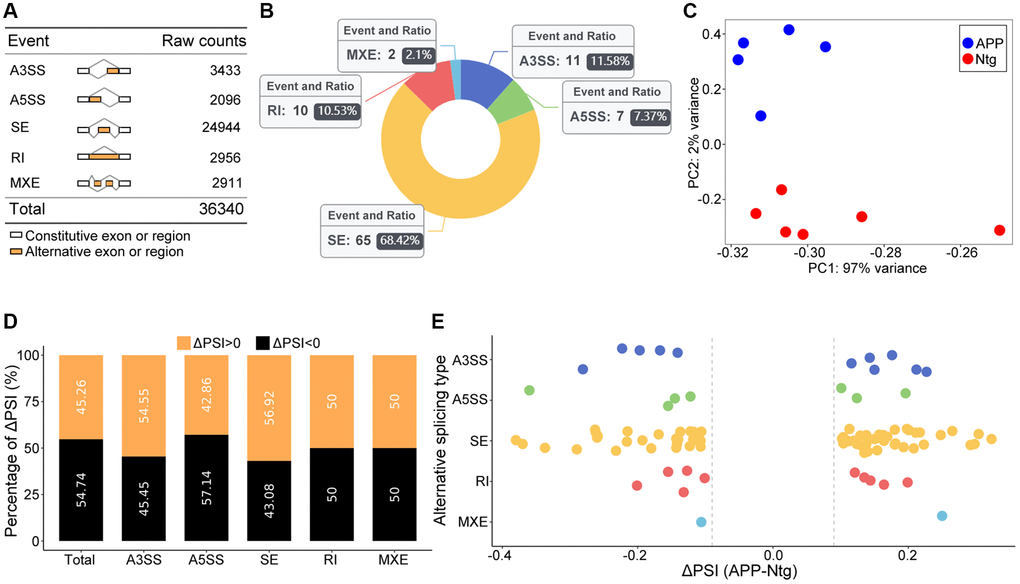
Figure 1.Global summary of AS events. (A) Raw counts in each AS event. (B) Number and ratio of each significant AS event. (C) The PCA plot based on PSI values. APP and Ntg groups were clearly classified. (D) The percent of ΔPSI in each and global AS events. (E) Distribution of ΔPSI in each type AS events.