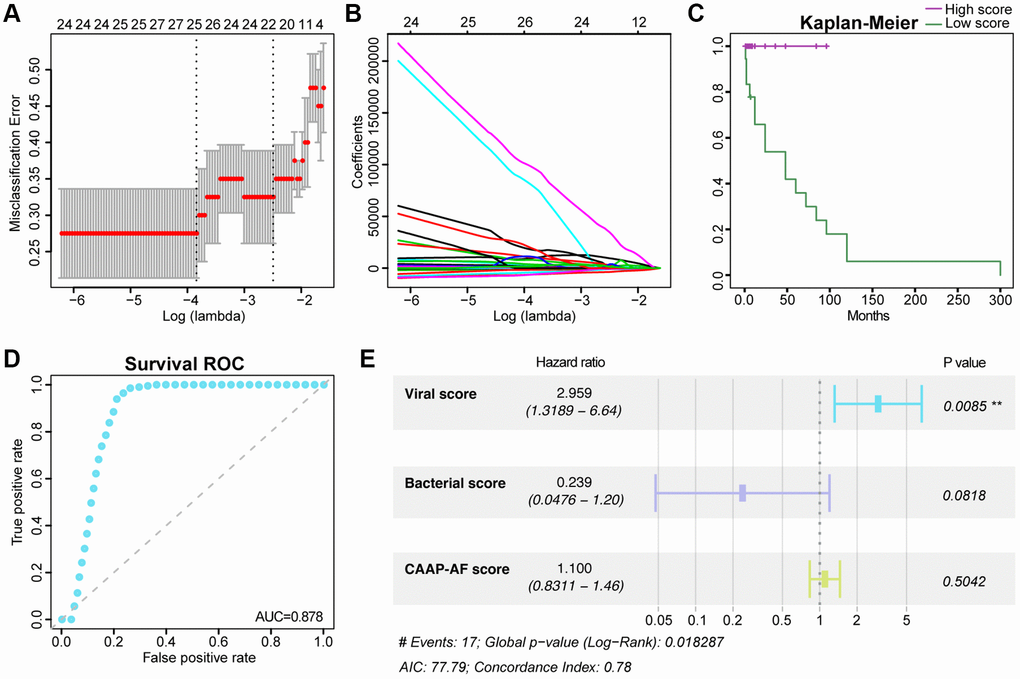
Figure 5.Association of the gut viral signals with the risk of recurrent AF. The tuning index (lambda) was identified utilizing the LASSO. Then, receiver operating characteristic (ROC) curve analysis was performed, and the AUC was plotted against log (lambda) (A). Dotted vertical lines represent the optimal values based on the minimum criteria and one standard error of the minimum criteria (1-SE criteria). Coefficients versus log (lambda) are shown (B). Kaplan-Meier curve analysis of overall survival based on the viral score (C). Survival ROC curves for the viral score (D). Forest plot of multivariate Cox regression analysis of virome-related risk groups and baseline patient covariates (E). Hazard ratios and 95% CIs are shown. Abbreviations: C-index: concordance index; CI: confidence interval.