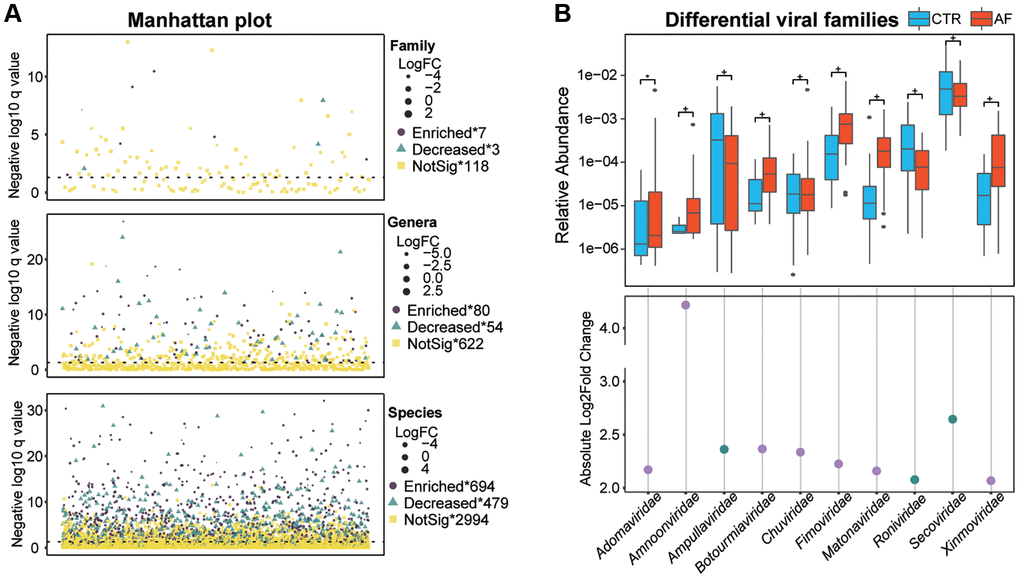
Figure 2.Altered gut viral composition in AF. The Manhattan plot shows an overview of differentially enriched viral taxa between non-AF and AF individuals (A). Box plots of differentially enriched viral families (B) between non-AF control and AF individuals. Boxes are interquartile ranges; lines denote medians; circles are outliers. The scatter plot shows absolute values of Log 2 (fold change of CTR/AF), while dots colored in purple and green denote enriched viruses in AF and controls, respectively. + denotes adjusted p (q) value < 0.01, *q < 0.05, and NS indicates no significant difference based on DESseq analysis.