Submit an Article
Navigate
Home
Editorial Board
Editorial Policies
Current Volume
Archive
Scientific Integrity
Publication Ethics Statements
Interviews with Outstanding Authors
Newsroom
Sponsored Conferences
Podcast
Contact
Special Collections
Submit an Article
Online ISSN: 1945-4589
Research Paper
|
Volume 14, Issue 15
|
pp. 6227–6254
CBXs
-related prognostic gene signature correlates with immune microenvironment in gastric cancer
Back to article
Figure 2
(2 of 11)
−
100%
+
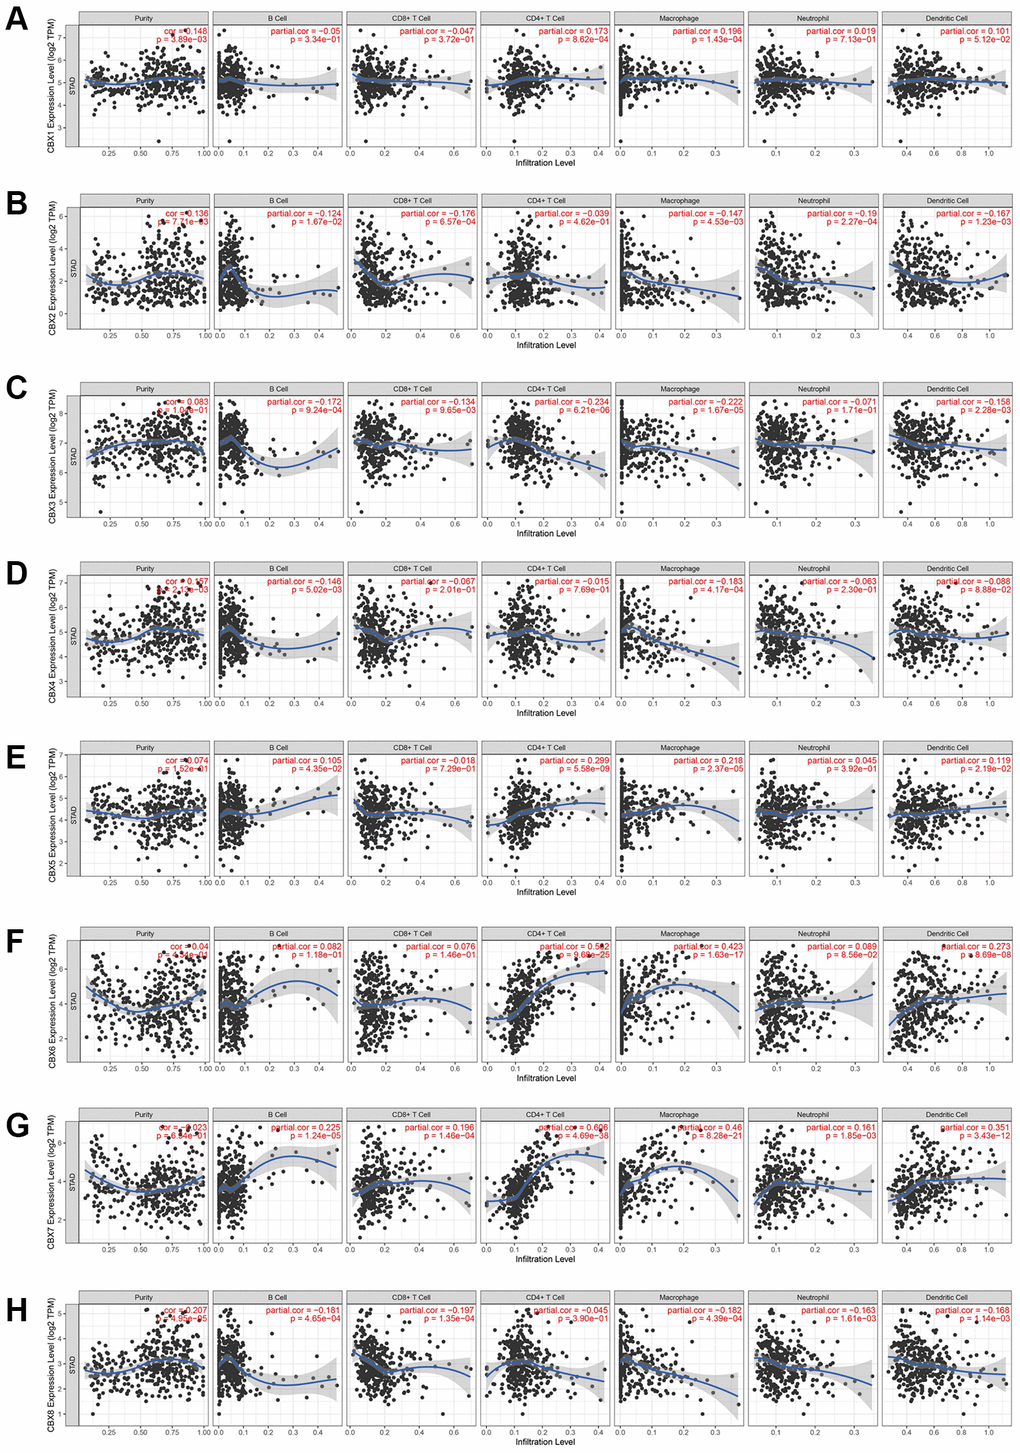
Figure 2.
The correlation between
CBXs
and immune cell infiltration was analyzed by the TIMER database.
(
A
)
CBX1
; (
B
)
CBX2
; (
C
)
CBX3
; (
D
)
CBX4
; (
E
)
CBX5
; (
F
)
CBX6
; (
G
)
CBX7
; (
H
)
CBX8
.