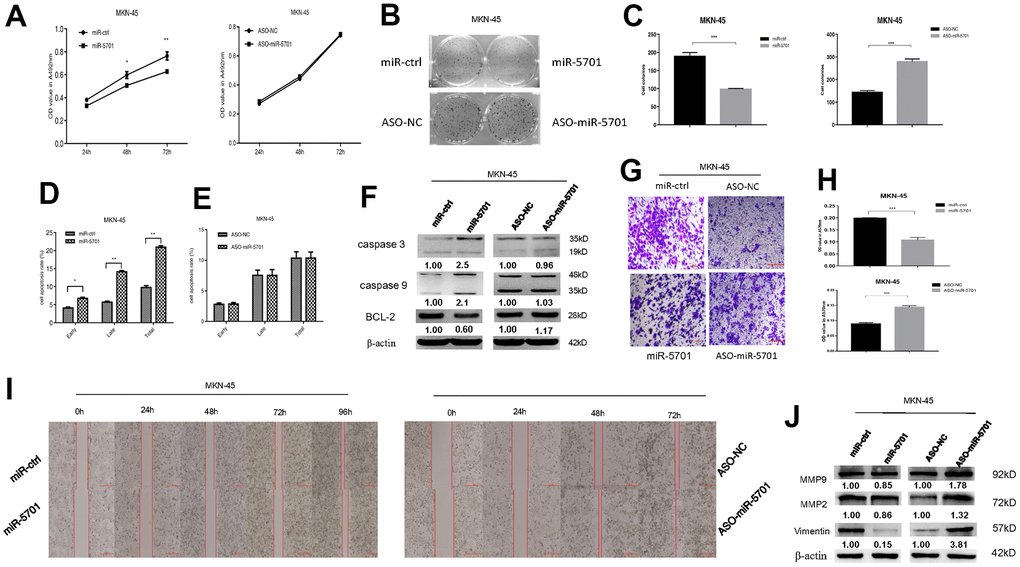
Figure 3.Expression and function of miR-5701 in GC cell line MKN-45 which was infected with miR-5701 or were treated with ASO-miR-5701. (A) Cell viability was measured by MTT assay at the time of 24h, 48h and 72h. (B, C) Cell proliferation was measured by colony formation assay; (D, E) Cell apoptosis was checked by flow cytometry; (F) Apoptosis-associated proteins were measured by Western blot; (G–J) Cell migration were measured by scratch assay and transwell assay, and migration associated proteins were measured by Western blot. Data are represented as the mean±SD and experiments were performed in triplicate; * p<0.05; ** p<0.01.