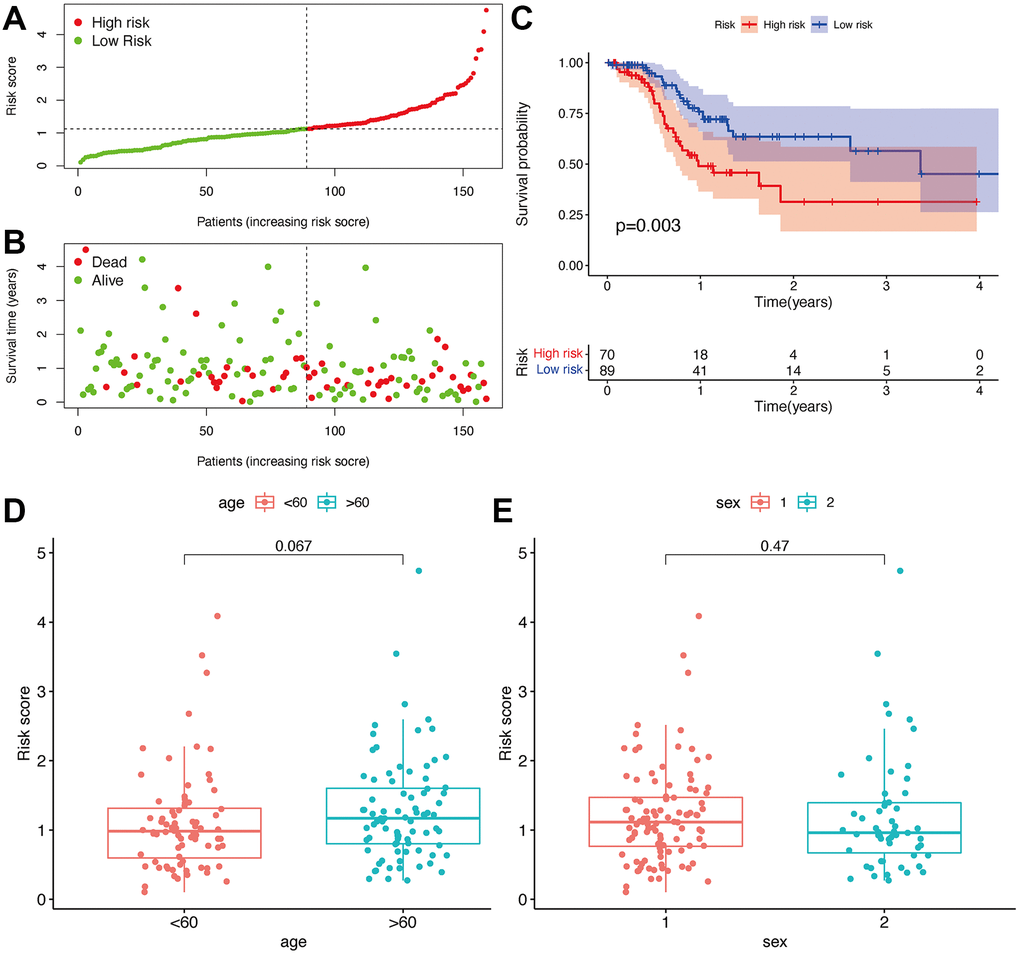
Figure 4.Prognostic prediction of the risk assessment model. Risk scores (A) and survival outcome (B) of each case. Kaplan-Meier survival curve of high-risk group and low-risk group (C). The scatter plot showed that age (D) and sex (E) were not significantly correlated with a risk score.