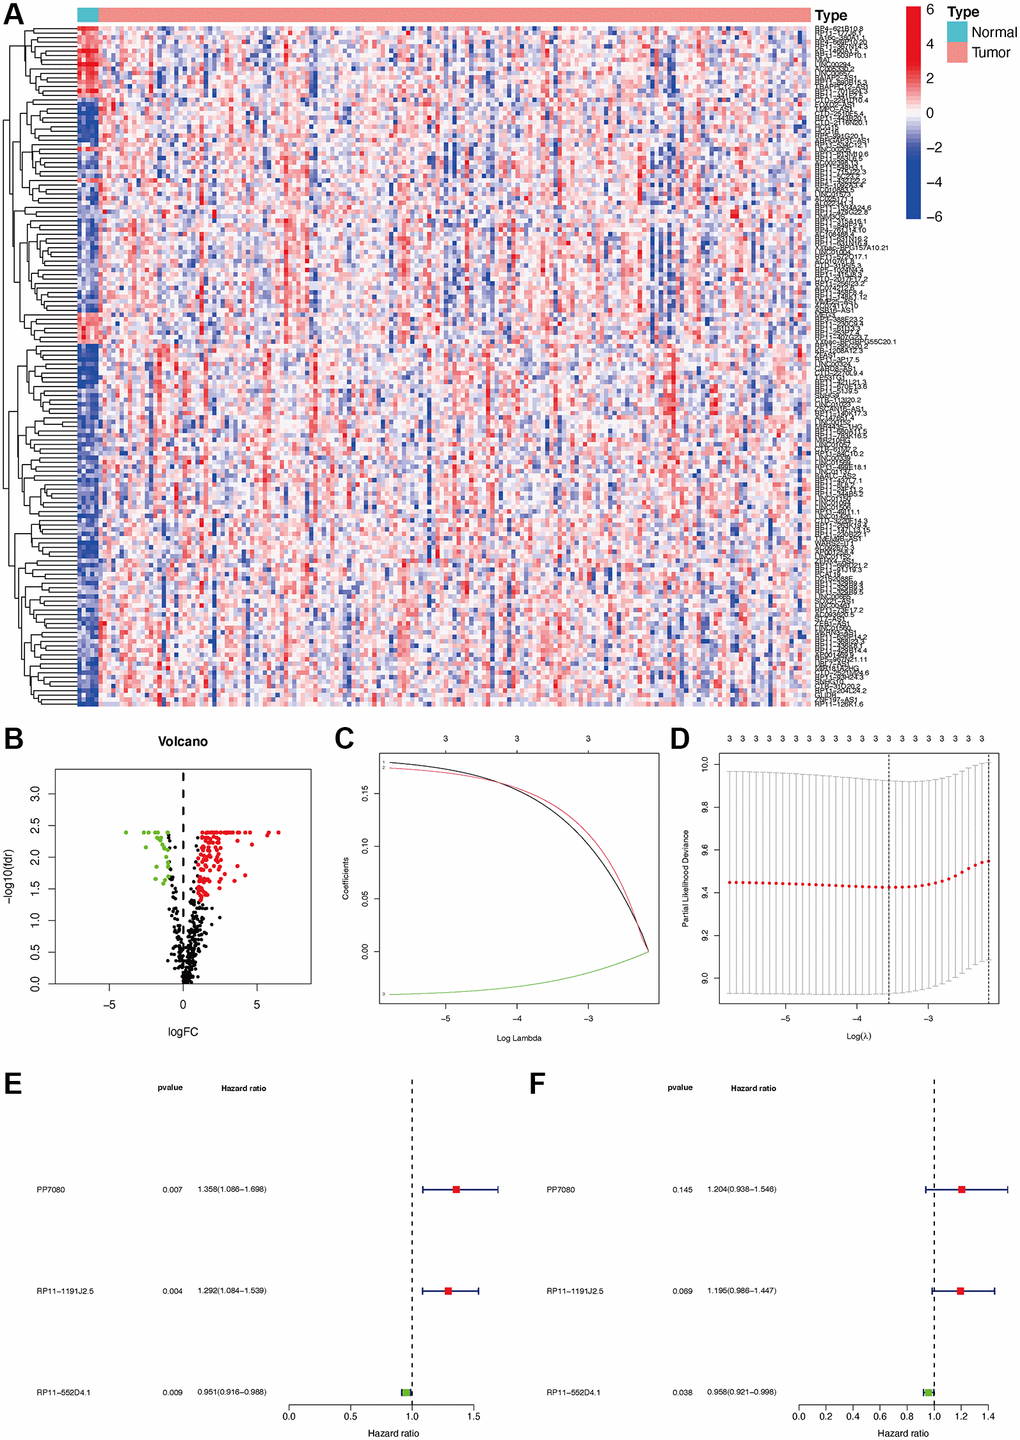
Figure 2.Establishment of a risk assessment model based on DEmlncRNA differentially expressed m6A-related lncRNAs (DEmlncRNAs). The heatmap (A) and a volcano plot (B) were displayed. Establishment of the LASSO regression (C and D). 3 DEmlncRNA were shown by a forest map with univariate and multivariate Cox analysis (E and F).