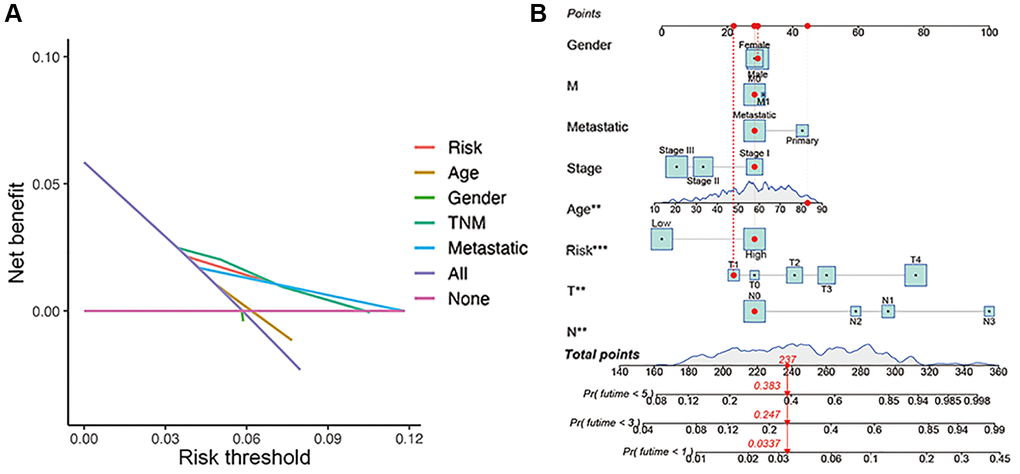
Figure 5.Construction of nomogram. (A) Decision curve analysis of risk signature and other clinicopathological features. (B) Nomogram for predicting CM 1-, 3-, and 5-year overall survival in TCGA cohort. The red dashed line represented a sample of CM patient's death probability by year 1, 3, and 5.