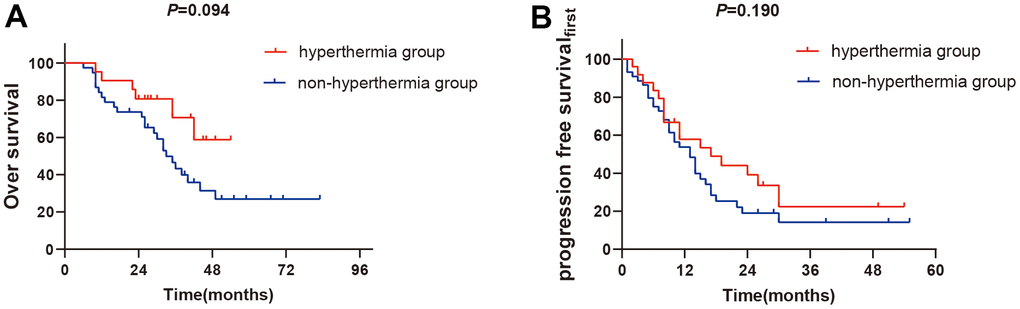
Figure 3.The subgroups analysis of EGFR mutation between two groups. (A) 1-year OS rates of EGFR mutation between two groups (P>0.05). (B) 1-year PFSfirst rates of EGFR mutation between two groups (P>0.05).
Figure 3 — The efficacy of adding hyperthermia to the treatment of advanced NSCLC patients based on the states of EGFR | Aging