Submit an Article
Navigate
Home
Editorial Board
Editorial Policies
Current Volume
Archive
Scientific Integrity
Publication Ethics Statements
Interviews with Outstanding Authors
Newsroom
Sponsored Conferences
Podcast
Contact
Special Collections
Submit an Article
Online ISSN: 1945-4589
Research Paper
|
Volume 14, Issue 12
|
pp. 5211–5222
DNA methylation-regulated SNX20 overexpression correlates with poor prognosis, immune cell infiltration, and low-grade glioma progression
Back to article
Figure 8
(8 of 10)
−
100%
+
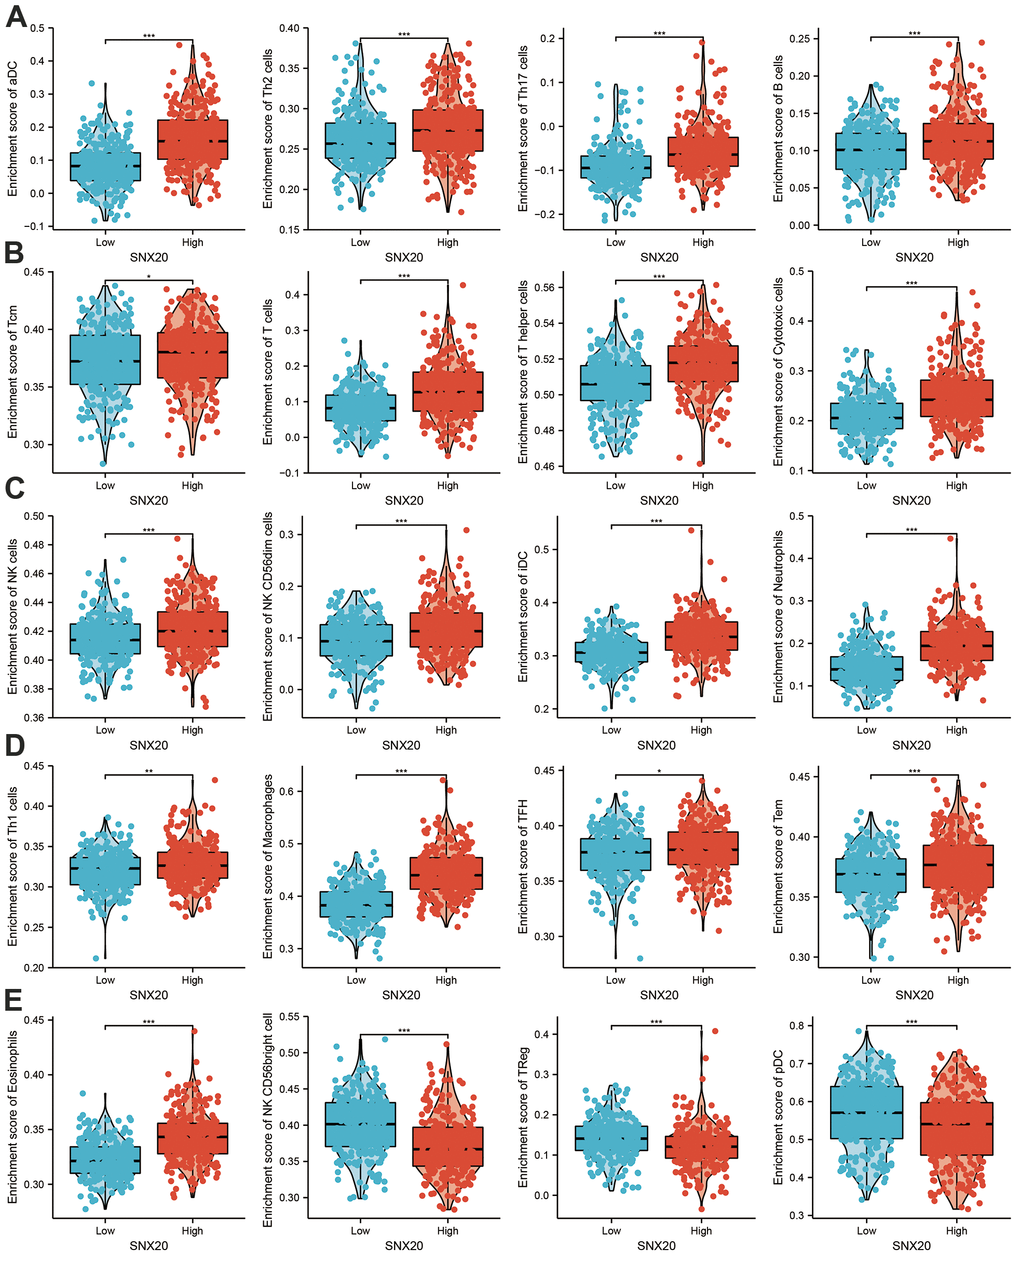
Figure 8.
Analysis the correlation between SNX20 expression and diverse immune cell infiltration.
(
A
–
E
) Diverse proportions of immune cell subtype in tumor samples in high and low SNX20 expression groups.