Submit an Article
Navigate
Home
Editorial Board
Editorial Policies
Current Volume
Archive
Scientific Integrity
Publication Ethics Statements
Interviews with Outstanding Authors
Newsroom
Sponsored Conferences
Podcast
Contact
Special Collections
Submit an Article
Online ISSN: 1945-4589
Research Paper
|
Volume 14, Issue 12
|
pp. 5195–5210
POC1A, prognostic biomarker of immunosuppressive microenvironment in cancer
Back to article
Figure 11
(11 of 12)
−
100%
+
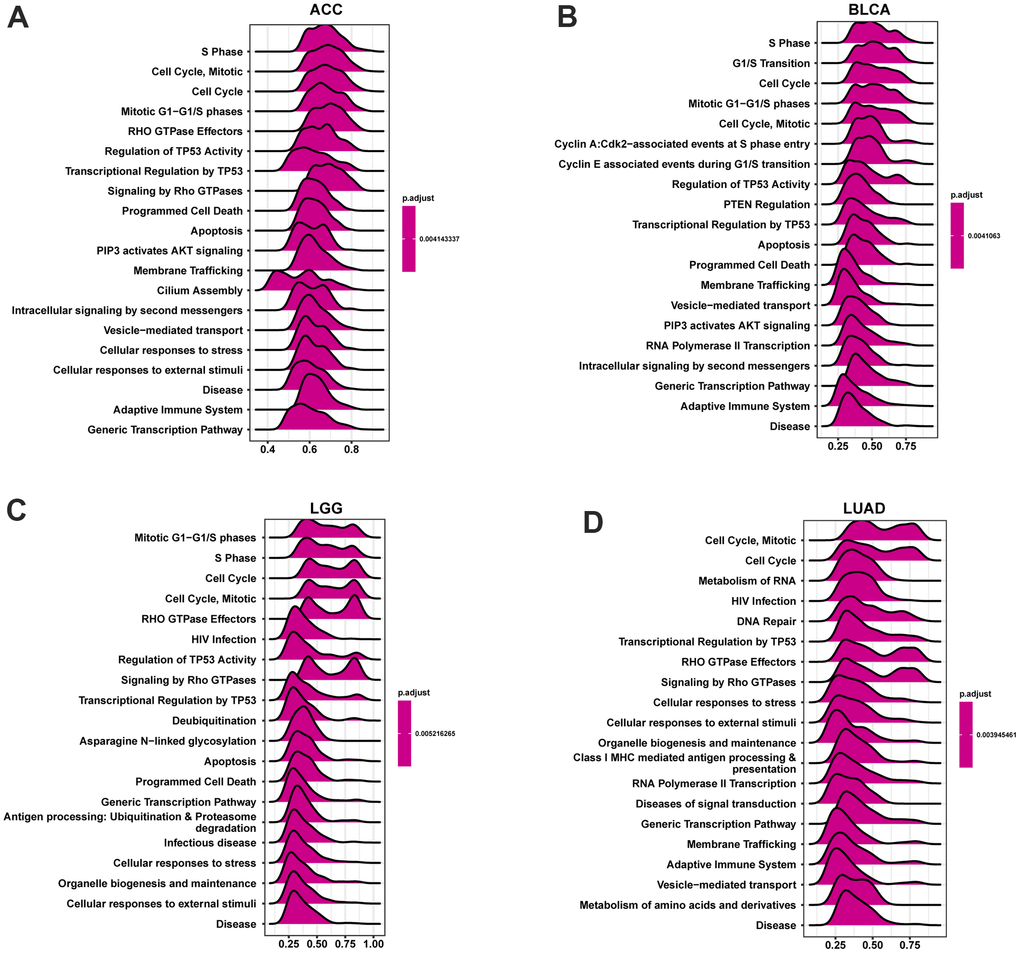
Figure 11.
GSEA analysis of POC1A in pan-cancer.
(
A
–
D
) GSEA detected the top twenty genes of indicated tumors (NES ≥ 1.5, adjusted P < 0.05). Red implies immune regulation-related or cell cycle-related pathways.