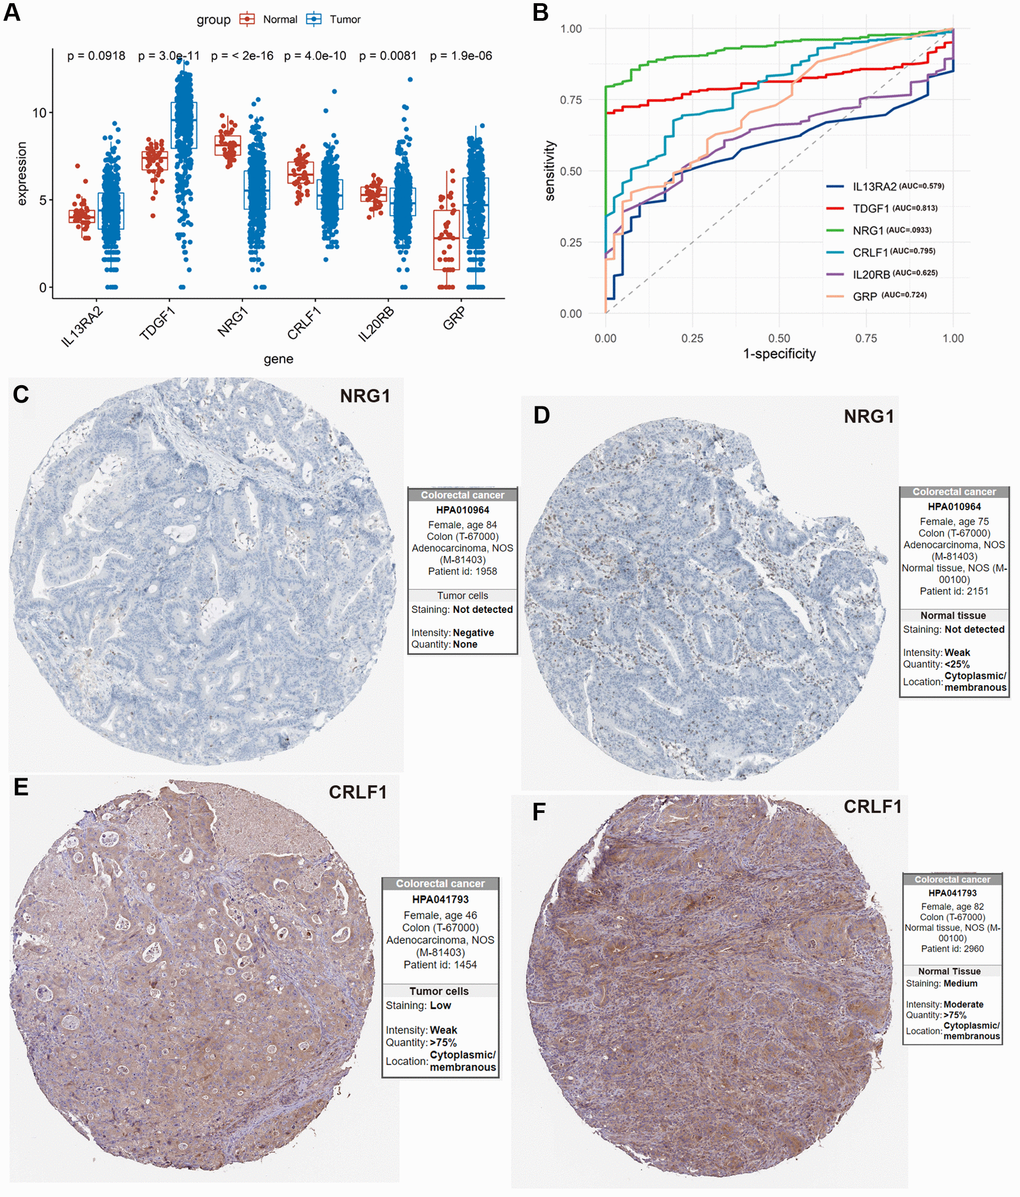
Figure 6.Exploration of the 6 IRIGs as predictive diagnostic indicators based on the TCGA-COAD cohort. (A) Comparison of the expressions of the IRIGs between tumor and normal samples using the Wilcoxon test. (B) Establishment of the predictive diagnosis model using the 6 IRIGs. (C–F) The comparison of protein expression of NRG1 and CRLF1 between tumor and normal tissues.