Submit an Article
Navigate
Home
Editorial Board
Editorial Policies
Current Volume
Archive
Scientific Integrity
Publication Ethics Statements
Interviews with Outstanding Authors
Newsroom
Sponsored Conferences
Podcast
Contact
Special Collections
Submit an Article
Online ISSN: 1945-4589
Research Paper
|
Volume 14, Issue 12
|
pp. 5131–5152
Exploring immune-related signatures for predicting immunotherapeutic responsiveness, prognosis, and diagnosis of patients with colon cancer
Back to article
Figure 5
(5 of 6)
−
100%
+
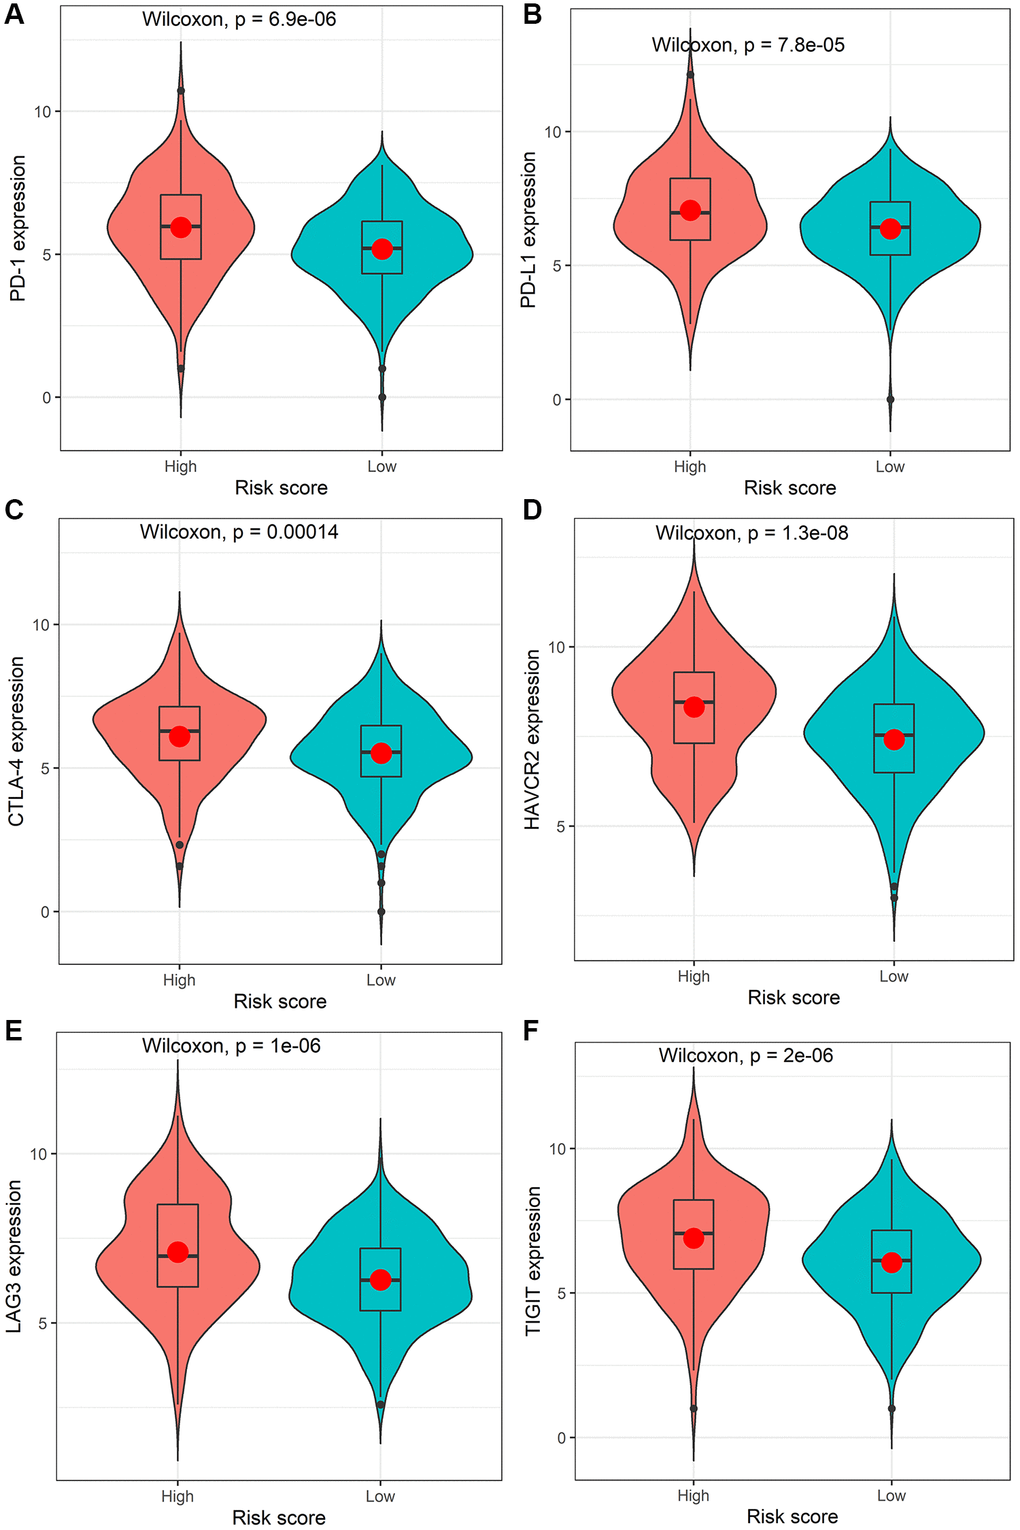
Figure 5.
Comparison of the expression levels of the immune checkpoints and their ligands between the high-risk score group and low-risk score group.
The expression of
PD-1
(
A
)
, PD-L1
(
B
)
, CTLA-4
(
C
)
, HAVCR2
(
D
)
, LAG3
(
E
), or
TIGIT
(
F
).