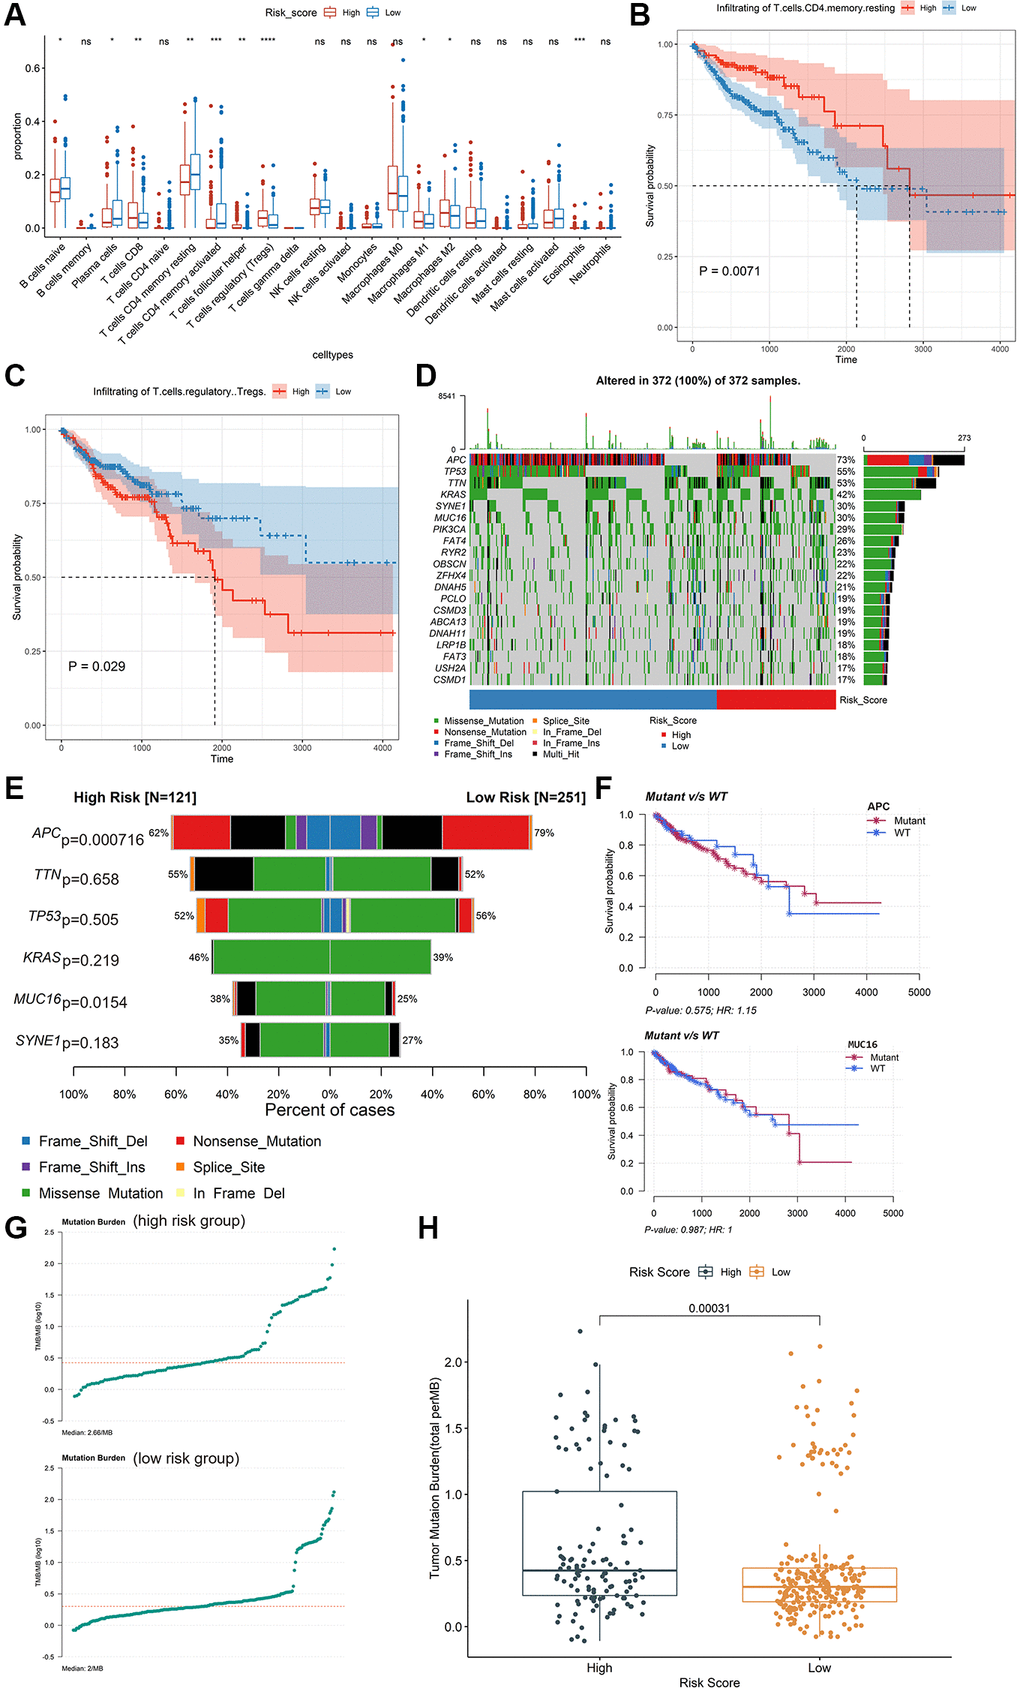
Figure 4.Exploring potential immunotherapy-related signatures. (A) Comparison of the differences in the proportions of immune cells between low-risk group and high-risk group using the Kruskal-Wallis test. The values of P were labelled above each boxplot with asterisks. (*P < 0.05, **P < 0.01, ***P < 0.001, ****P < 0.0001). (B and C) The Kaplan-Meier analysis of the associations between the level of T cells regulatory (Tregs) and T cells CD4 memory resting with patients’ OS. (D) The mutation profiles of the high-risk and low-risk groups. (E) Comparison of the mutation rate between high-risk group and low-risk group. (F) The association between the mutation status of APC and MUC16 and patients’ OS. (G) The TMB profiles of the low-risk group and high-risk group. (H) Comparison of the difference in TMB between high-risk and low-risk groups.