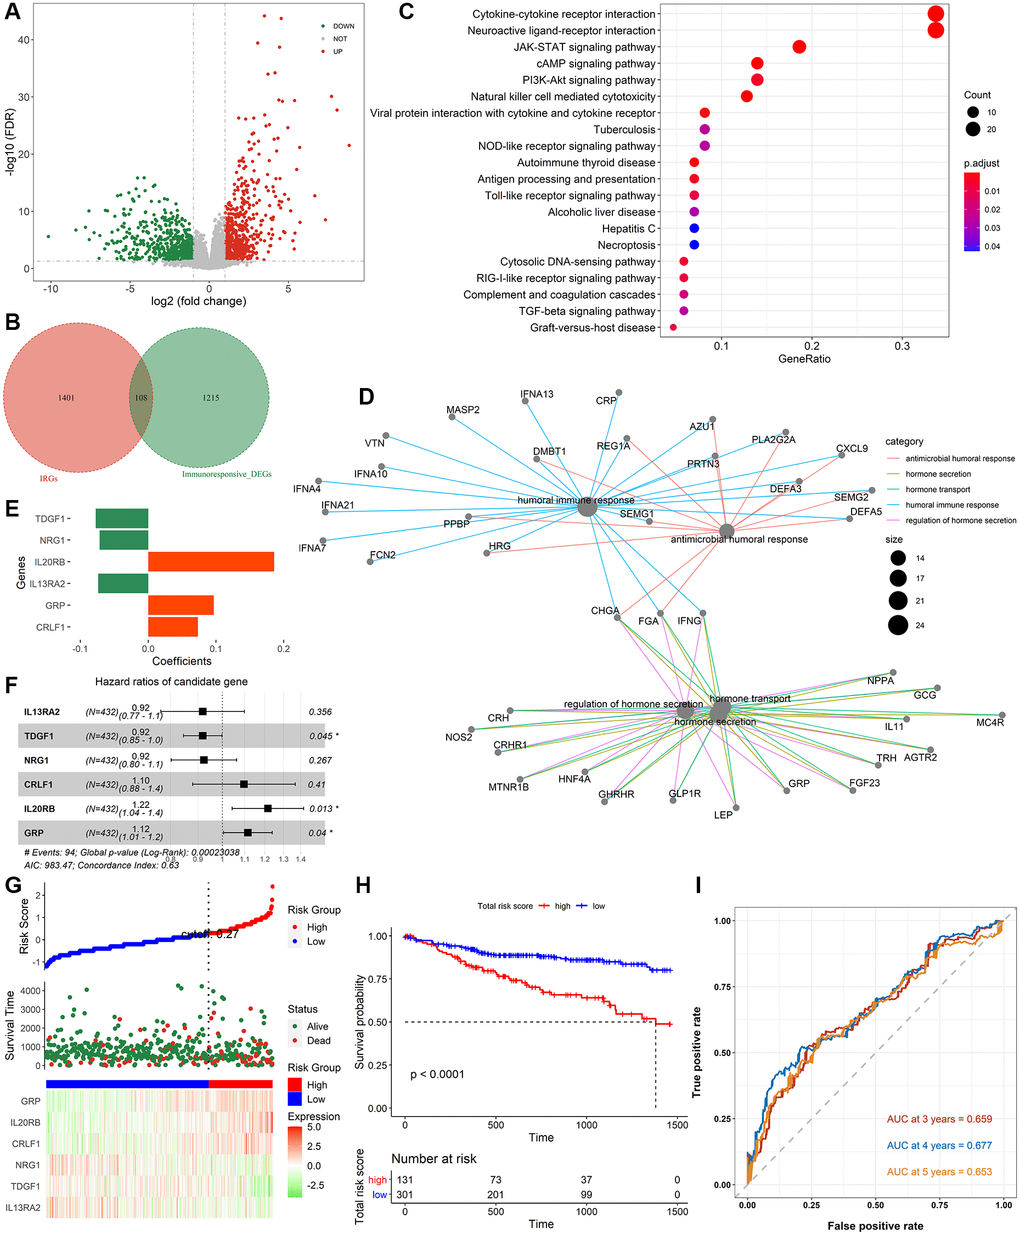
Figure 2.Identification of immune-related signatures and construction of IRIRScore prognostic model. (A) Volcano plot on immunotherapeutic response related DEGs between the responders and non-responders in anti-PD-L1 cohort. The green dots represent downregulated genes, while the red dots represent upregulated genes. (B) Venn diagram of the intersection between the immunotherapeutic response related DEGs and IRGs. (C) KEGG pathway enrichment analysis of IRIGs. (D) GO analysis of IRIGs. (E) The coefficients of the 6 IRIGs related to prognosis of colon cancer. (F) Forest plot showing the HR of each IRIG. (G) The distribution of samples in the high- and low risk score groups and their relationship with OS, and the expression pattern of 6 prognostic signatures in high- and low risk score groups. (H) Kaplan-Meier curve exhibited that OS of patients in the low-risk score group was significantly higher than those in the high-risk score group. (I) Time-dependent ROC curve analysis of the IRIRScore model.