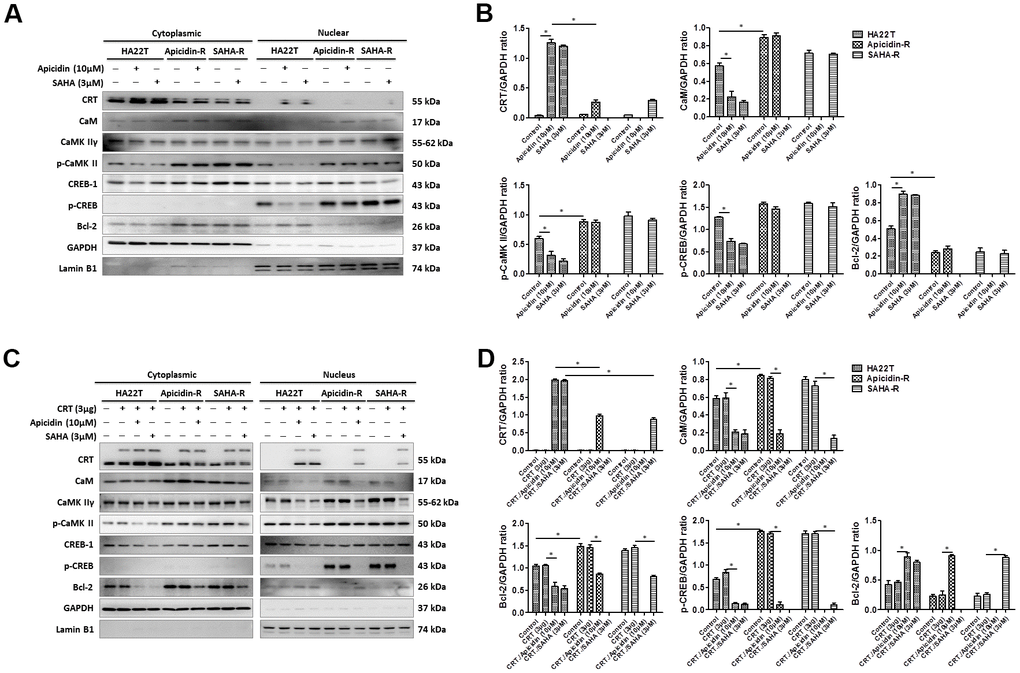
Figure 4.HDAC inhibitors trigger CRT translocation to the nucleus in liver cancer cells overexpressing CRT. (A, B) HDAC inhibitors activate CRT nuclear translocation and inhibit CaM/CaMKII/CREB signaling pathway in the nuclear isolate of the HA22T parental cells. (C, D) HDAC inhibitors activate CRT nuclear translocation and inhibit CaM/CaMKII/CREB signaling pathway in the nuclear isolate of HCC cells overexpressing CRT.
(E–G) HCC cells treated with vehicle, transfected with CRT-plasmid, or HDAC inhibitors alone or in combination exhibit DNA damage, as determined by TUNEL assays. Scale bar = 100 μm. Upper panel: Green fluorescence indicates CRT-transfected HCC cells. HCC cells are stained with fluorescein-labeled dUTP according to the protocols reported in the Methods section. Red fluorescence indicates TUNEL-positive cells. Lower panel: HCC cells in the upper panel are stained with 4',6-diamidino-2-phenylindole (DAPI) to identify cell nuclei. (H) Rate of apoptosis is calculated as the percentage of TUNEL-positive cells among the total number of counted parental and resistant cells (mean ± SD, n = 3). (I–K) Cells are seeded in an 8-well chamber and treated with vehicle, CRT-plasmid, or HDAC inhibitors alone or in combination. HDAC inhibitors trigger CRT translocation to the nucleus and stimulate calcium accumulation, analyzed by confocal microscopy. Scale bar = 10 μm. Mean values are significantly different than that in control group. *p< 0.05, **p< 0.01, ***p< 0.001.