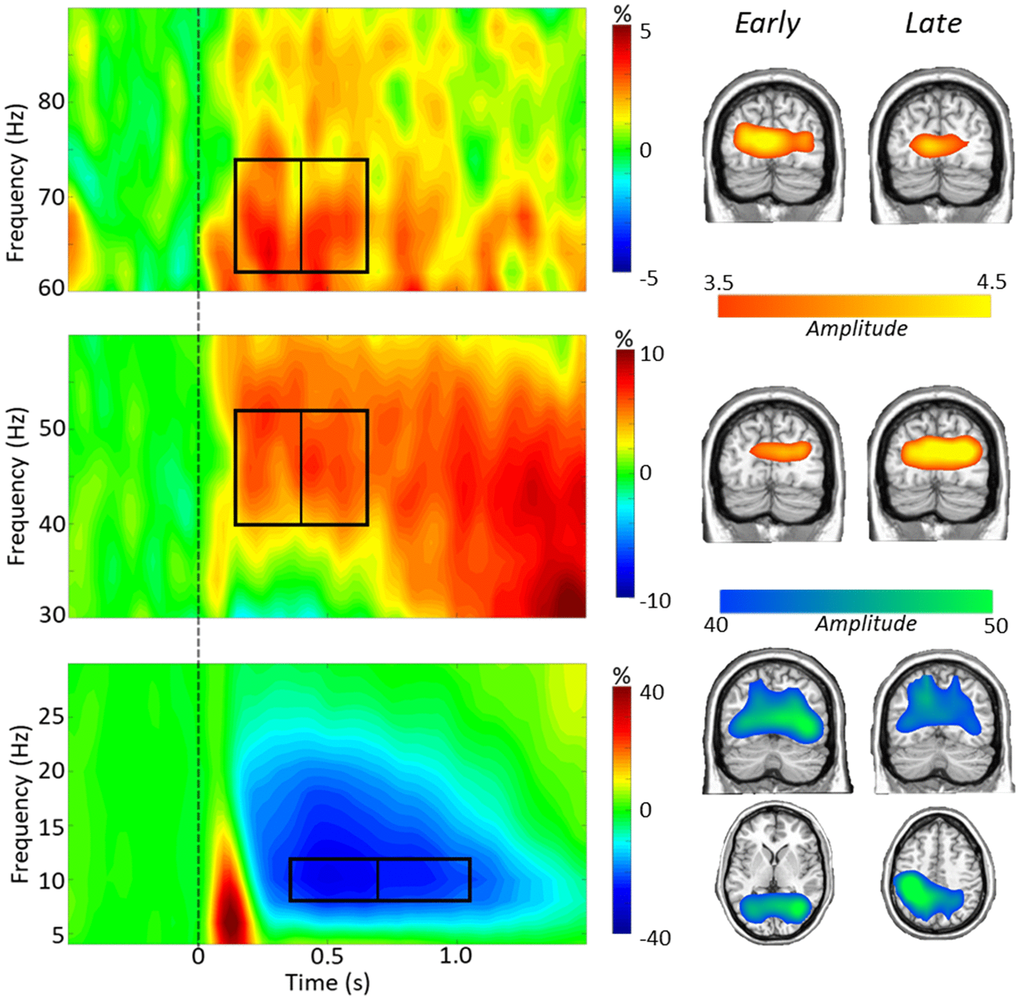
Figure 2.Task switch spectrograms. Left: Grand-averaged time-frequency spectrograms are shown, derived from representative parieto-occipital MEG sensors. Time is shown on the x-axis in seconds, frequency is shown on the y-axis in Hz. Spectrograms are shown from 4–30 Hz (bottom), 30–60 Hz (middle), and 60–90 Hz (top). The colors reflect power increases (red) and decreases (blue) relative to the baseline, with the scale bar shown to the right of each time-frequency plot. Time-frequency windows for source imaging (beamforming) were derived from statistical analysis of the sensor-level data across all participants (ps < 0.001). A clear alpha (8–12 Hz) decrease can be seen throughout the task period, as well as a lower gamma (40–52 Hz) and a higher gamma (62–74 Hz) synchronization during the task period. Right: Grand average images from each time-frequency bin show the alpha dynamics in parietal and occipital regions, and gamma dynamics largely restricted to bilateral occipital cortices.