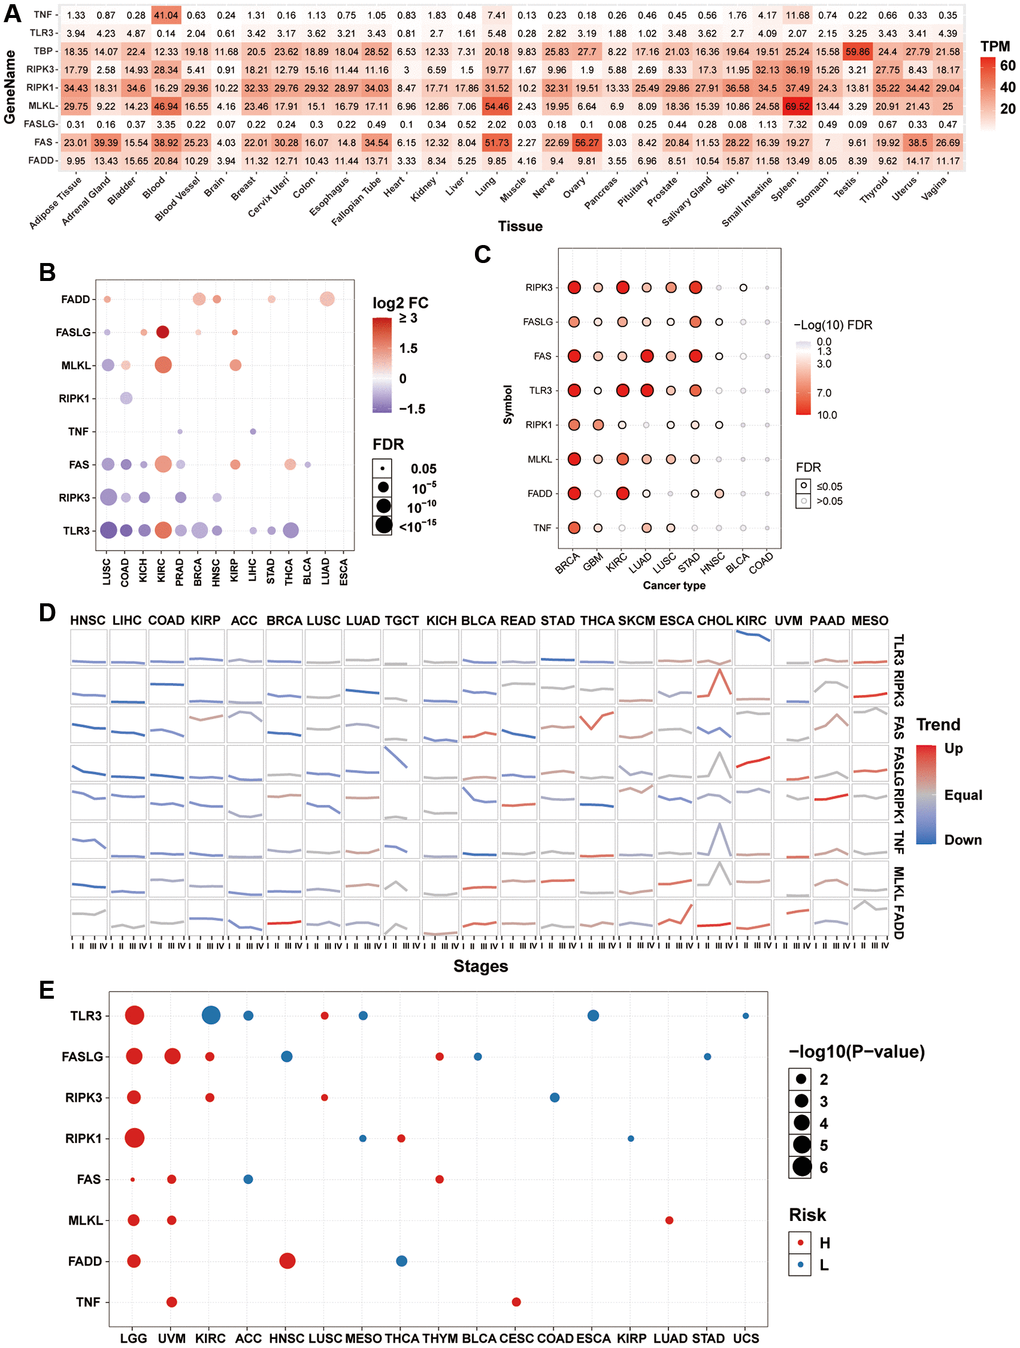
Figure 1.mRNA expression and survival analysis of necroptosis-related regulators. (A) mRNA expression of necroptosis-related regulators in the GTEx normal tissues. (B) Differential mRNA expression of necroptosis-related regulators between paired tumor and normal tissue. The size of dots is positively correlated with the FDR significance. The color of the bubble represents the fold change between tumor vs. normal. The bubble was filtered by the fold change (FC>2) and significance (FDR ≤ 0.05). (C) Subtype-related changes in gene expression of necroptosis-related regulators. The bubble color from white to red represents the FDR significance, and the bubble size is positively correlated with the FDR significance. The black outline border of bubble indicates FDR ≤ 0.05. (D) The trend of the gene expression of necroptosis-related regulators from stage I to stage IV in different cancers. The blue trend line and red trend line represent fall and rise tendency, respectively. (E) Survival analysis of necroptosis-related regulators in different cancers. The bubble color from blue to red represents the hazard ratio from low to high, bubble size is positively correlated with the Cox P-value significance.