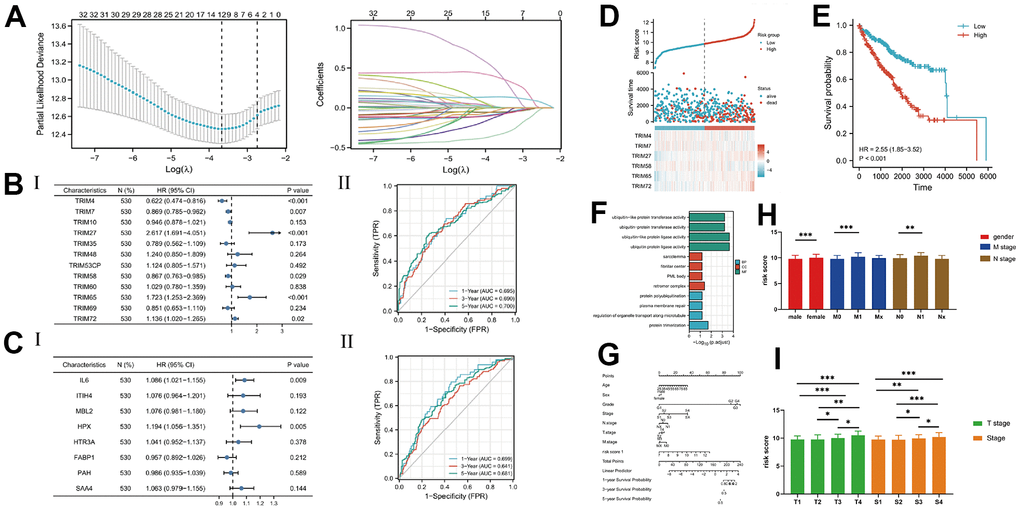
Figure 5.(A) The lasso analysis; (B, C) The Cox analysis and ROC analysis for two risk score; (D) The risk score and 6 TRIM genes' expression level; (E) The KM analysis of risk score; (F) The nomogram of the risk score and other clinical information; (G) The enrichment function analysis; (H, I) The detail expression level of the risk score in different clinical stages.