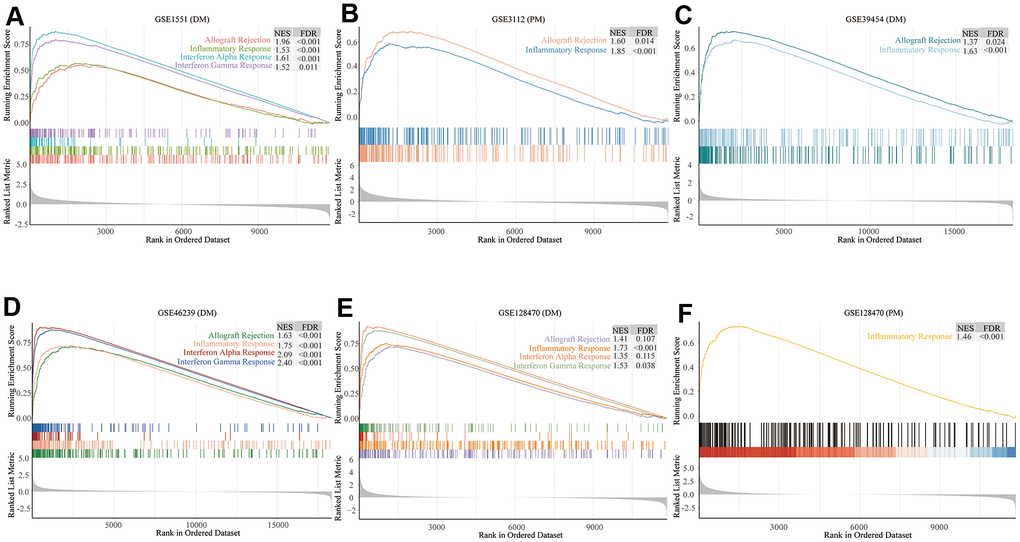
Figure 4.Gene set enrichment analysis (GSEA) results of six microarrays. Normalized enrichment score (NES) demonstrates the analysis outcomes across gene sets. False discovery rate (FDR) indicates if a set was meaningfully enriched. (A) GSE1551 (dermatomyositis, DM); (B) GSE3112 (polymyositis, PM); (C) GSE39454 (DM); (D) GSE46239 (DM); (E) GSE128470 (DM); (F) GSE128470 (PM).