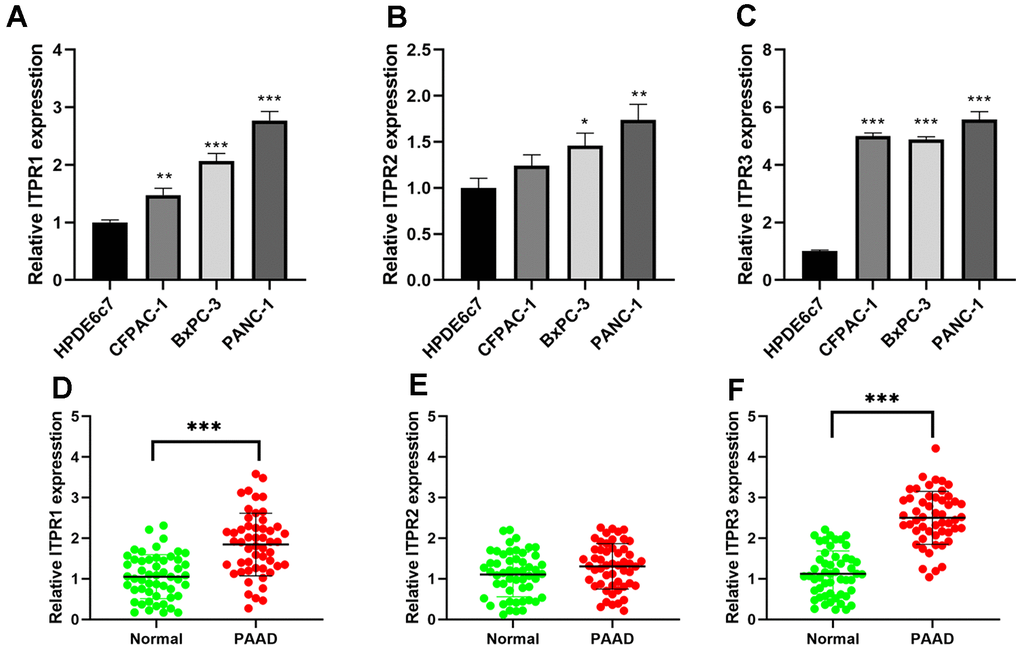
Figure 7.The expression levels of ITPRs in pancreatic cancer samples and cell lines. (A) The expression levels of ITPR1 in pancreatic cancer cell lines. (B) The expression levels of ITPR2 in pancreatic cancer cell lines. (C) The expression levels of ITPR3 in pancreatic cancer cell lines. (D) The expression levels of ITPR1 in pancreatic cancer samples. (E) The expression levels of ITPR2 in pancreatic cancer samples. (F) The expression levels of ITPR3 in pancreatic cancer samples.