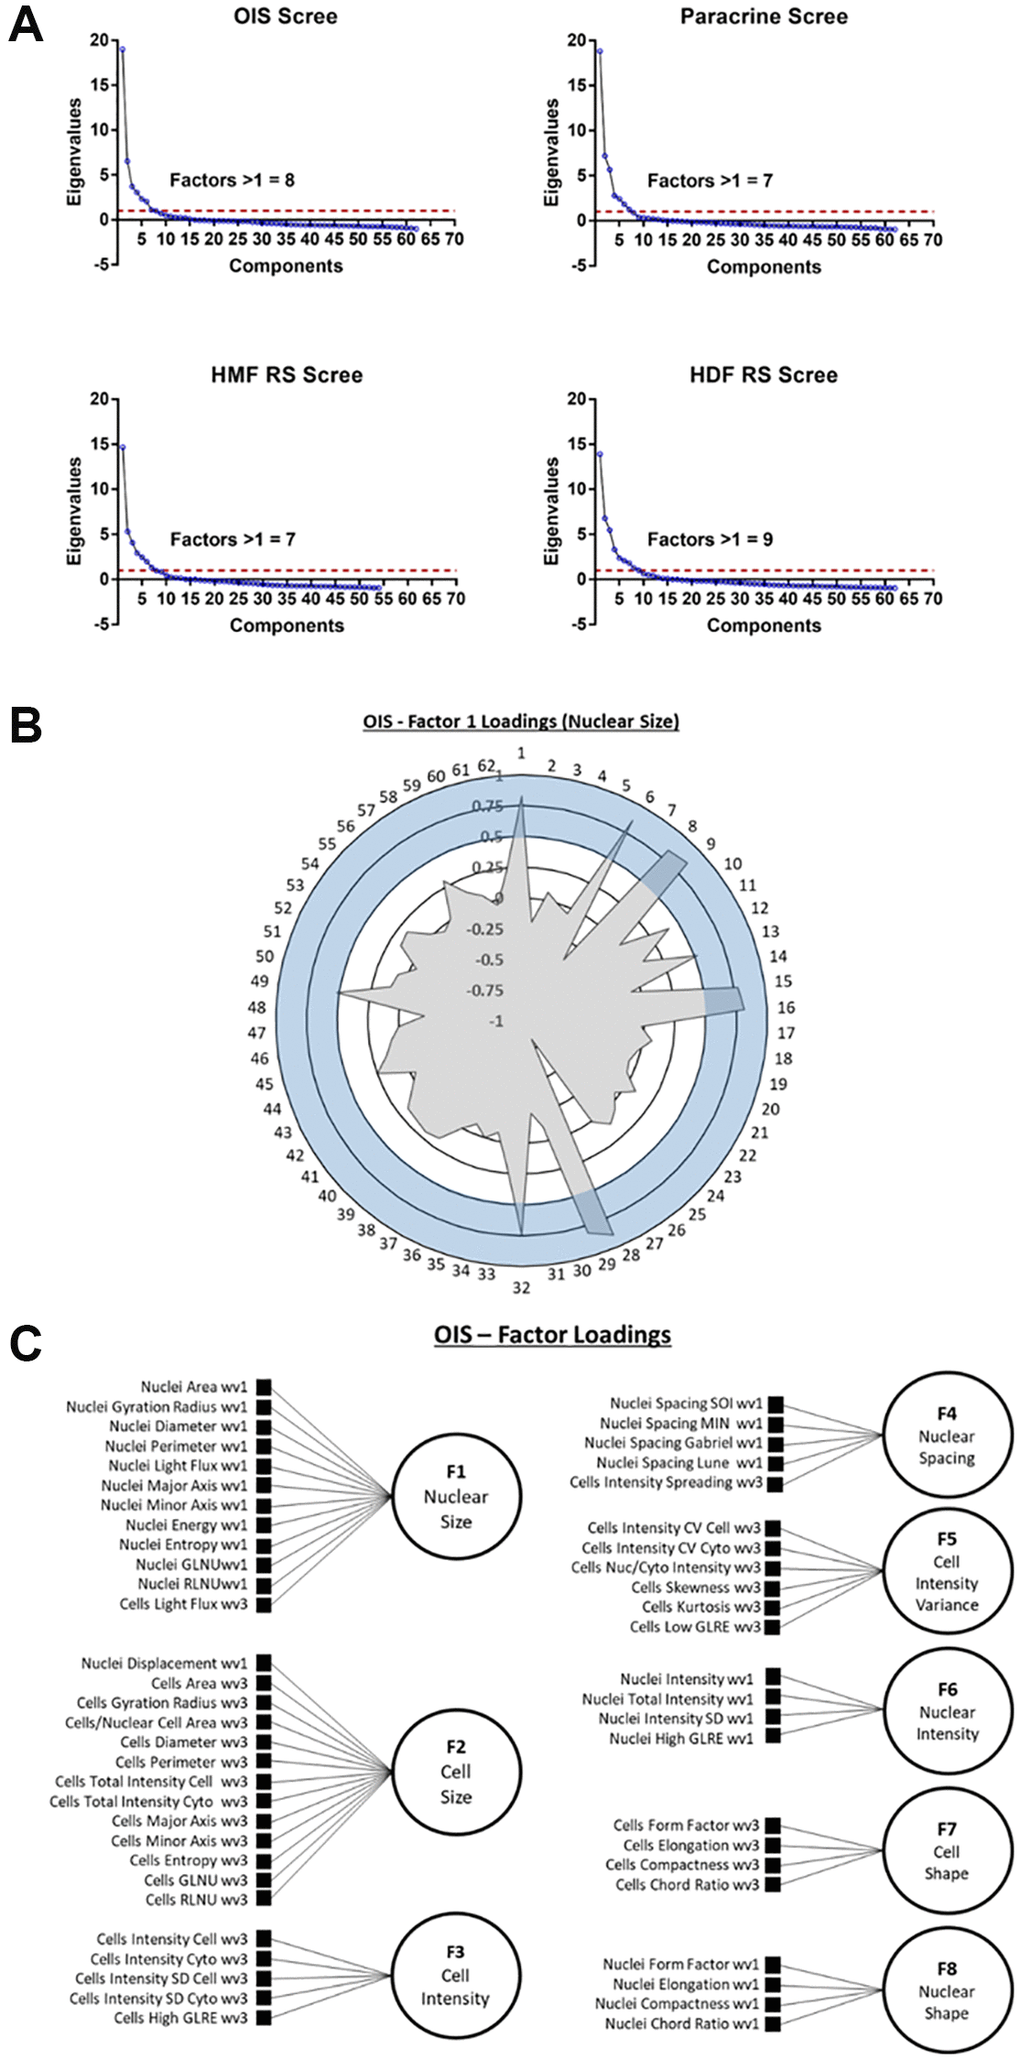
Figure 4.Exploratory factor analysis (EFA). (A) Scree plots for oncogene-induced senescence (OIS), paracrine senescence (Paracrine), HMF replicative senescence (HMF RS) and HDF replicative senescence (HDF RS) models. Red line indicates eigenvalue = 1. (B) Polar plot of factor loading values for factor 1 from OIS EFA model (designated Nuclear Size). 1–62 refer to features (Table 2). Blue shaded area indicates factor loading threshold of 0.5. (C) Factor loading diagram for OIS EFA model with factor designations. Equivalent diagrams for other senescence models are found in Supplementary Figure 3).