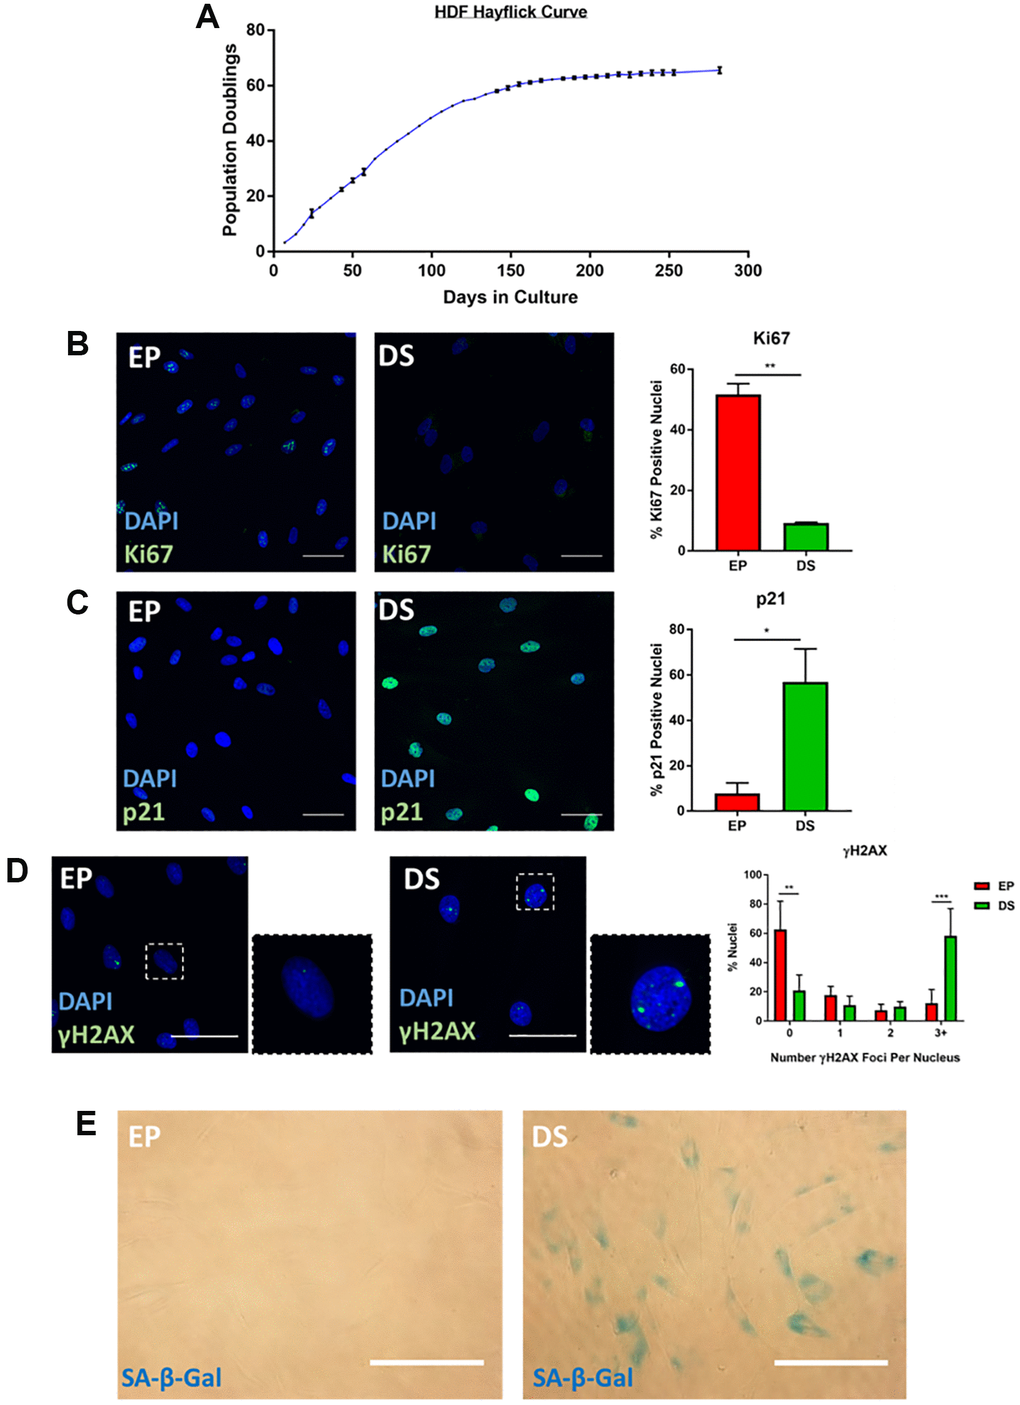
Figure 1.Characterisation of senescence in human dermal fibroblasts (HDFs). (A) Hayflick proliferation curve for human dermal fibroblasts (HDFs) from early proliferation (EP) to deep senescence (DS) through serial cell culture. N = 2–6. (B) Immunofluorescence staining of DAPI (blue) and Ki67 (green) in EP and DS HDFs. N = 2. Scale bar = 50 μm; (C) Immunofluorescence staining of DAPI (blue) and p21 (green) in EP and DS HDFs. N = 2. Scale bar = 50 μm (D) Immunofluorescence staining of DAPI (blue) and γ-H2AX foci (green) in EP and DS HDFs. N = 3. Scale bar = 50 μm. (E) Brightfield assessment of SA-β-Gal (blue) in EP and DS HDFs. N = 2. Scale bar = 100 μm.