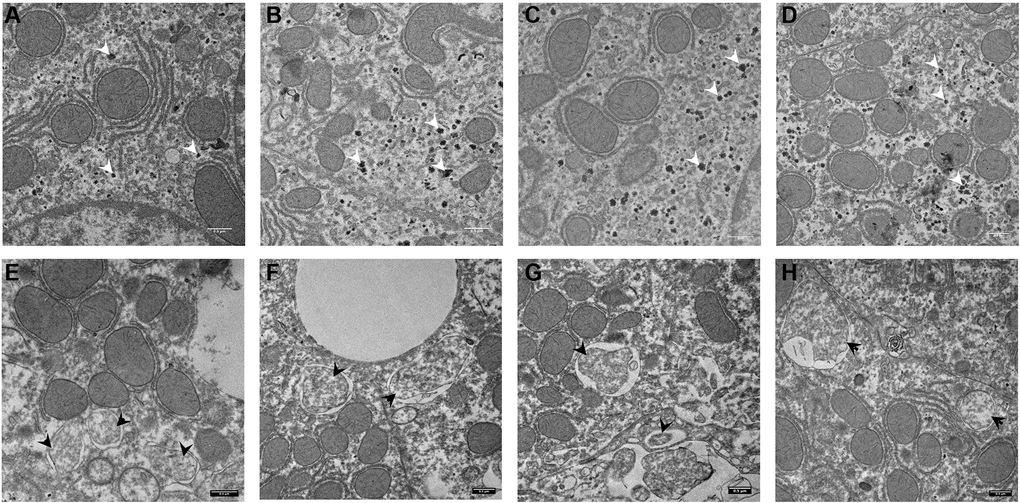
Figure 5.Electron microscopy images of autophagosomes in mouse liver. Control animal (A–D) vs. Chloroquine-treated animal (E–H). Highlighted are glycogen granules (white arrow) in controls and autophagosomes (black arrow) in the liver of treated animals. Scale bar, 0,5 μm. N = 3 for each group.