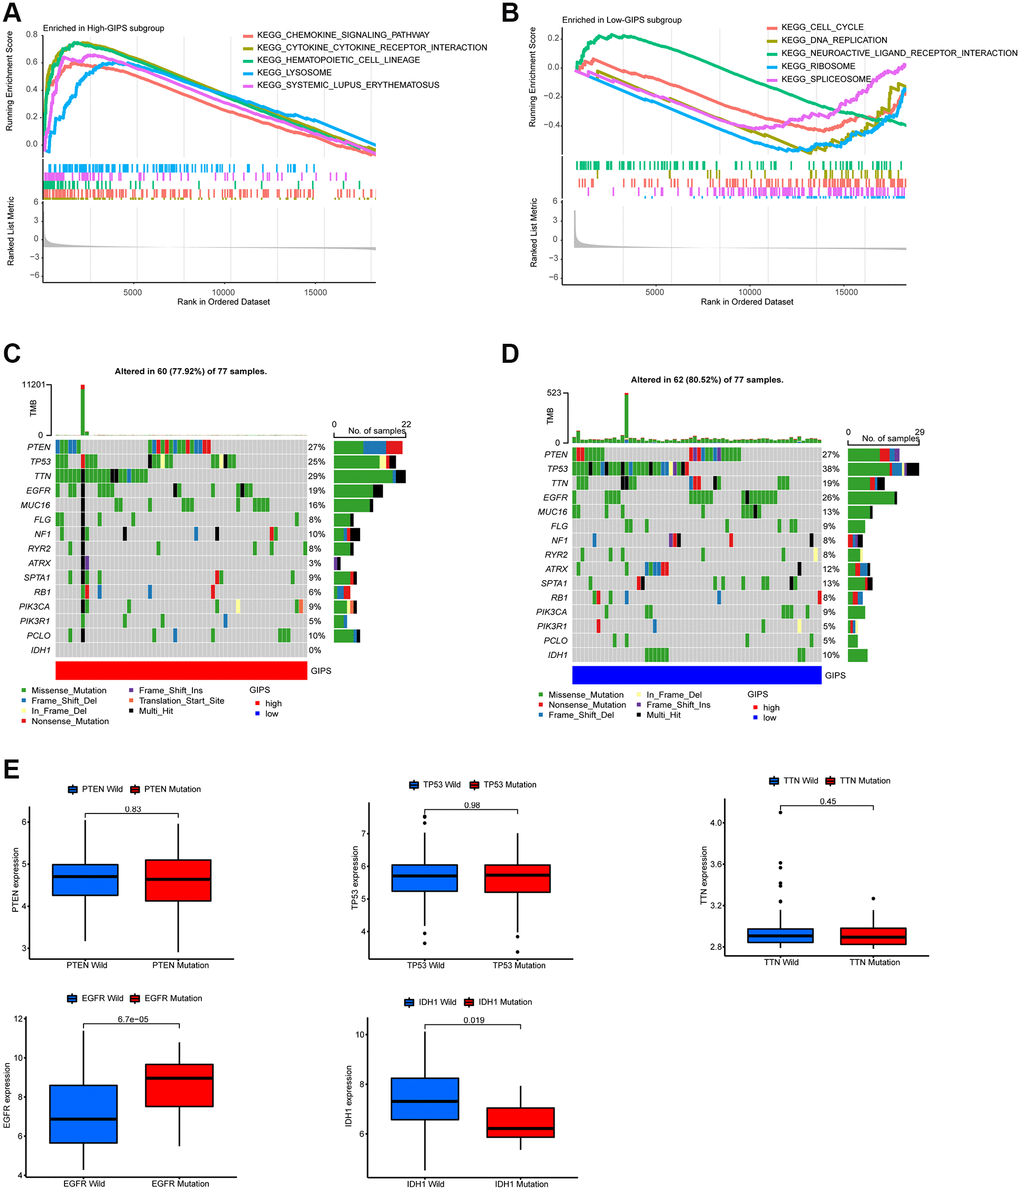
Figure 4.Molecular traits of distinct GIPS subgroups. (A) GSEA analysis in High-GIPS subgroup (P < 0.05). (B) GSEA analysis in Low-GIPS subgroup (P < 0.05). (C) Mutated genes (top 15) in High-GIPS subgroups. (D) Mutated genes (top 15) in Low-GIPS subgroups. (E) The correlation between expression level and mutations of genes (PTEN, TP53, TTN, IDH1 and EGFR).