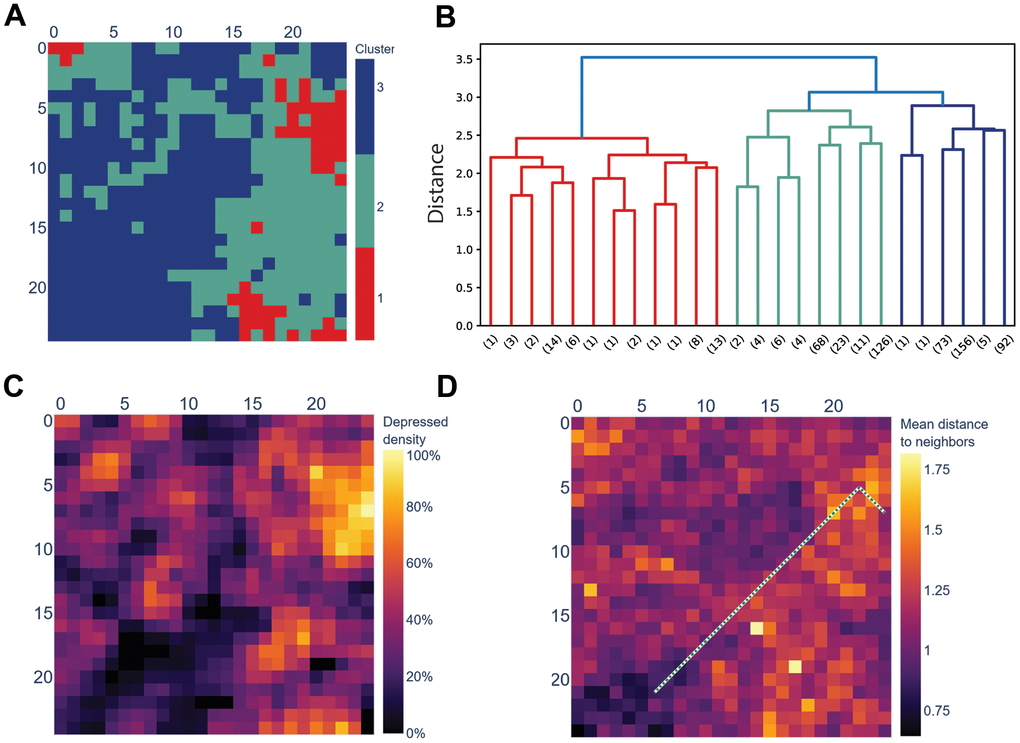
Figure 2.The SOM trained on a cohort of non-depressed people separates the depressed and the non-depressed. (A) Hierarchical clustering of SOM’s nodes identified three clusters; (B) Dendrogram of the clusters displayed in section A. Distance is Euclidean distance between clusters (complete linkage); numbers in brackets mark the number of leaves below the pruned branches; (C) Cluster-1 displayed in section A coincides with SOM’s cells to which more depressed, rather than non-depressed, respondents from the test cohort (N = 1173) are mapped. NA (dark green) marks the cells to which no respondents from the test cohort were mapped; (D) SOM colored by the average distance between a cell and its neighbors (U-matrix). The green dotted line is the shortest path between the cell with the most depressed respondents (top-right) and with the most non-depressed respondents (bottom-left).