Submit an Article
Navigate
Home
Editorial Board
Editorial Policies
Current Volume
Archive
Scientific Integrity
Publication Ethics Statements
Interviews with Outstanding Authors
Newsroom
Sponsored Conferences
Podcast
Contact
Special Collections
Submit an Article
Online ISSN: 1945-4589
Research Paper
|
Volume 14, Issue 8
|
pp. 3687–3704
F12 as a reliable diagnostic and prognostic biomarker associated with immune infiltration in papillary thyroid cancer
Back to article
Figure 11
(11 of 11)
−
100%
+
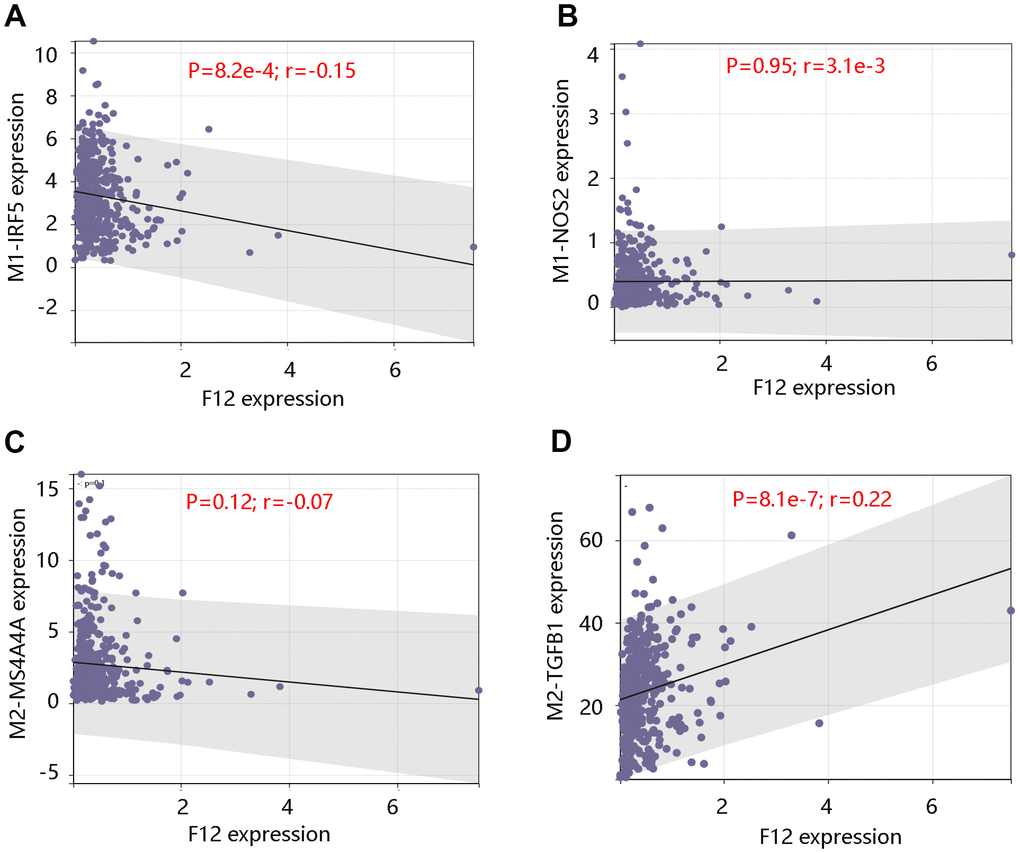
Figure 11.
Correlation between F12 expression and macrophage markers.
Relationship between F12 expression and M1 macrophage markers (
A
) IRF5 and (
B
) NOS2. Relationship between F12 expression and M2 macrophage markers (
C
) MS4A4A and (
D
) TGFB1.