Submit an Article
Navigate
Home
Editorial Board
Editorial Policies
Current Volume
Archive
Scientific Integrity
Publication Ethics Statements
Interviews with Outstanding Authors
Newsroom
Sponsored Conferences
Podcast
Contact
Special Collections
Submit an Article
Online ISSN: 1945-4589
Research Paper
|
Volume 14, Issue 8
|
pp. 3425–3445
Molecular characterization of matrix metalloproteinase gene family across primates
Back to article
Figure 7
(7 of 10)
−
100%
+
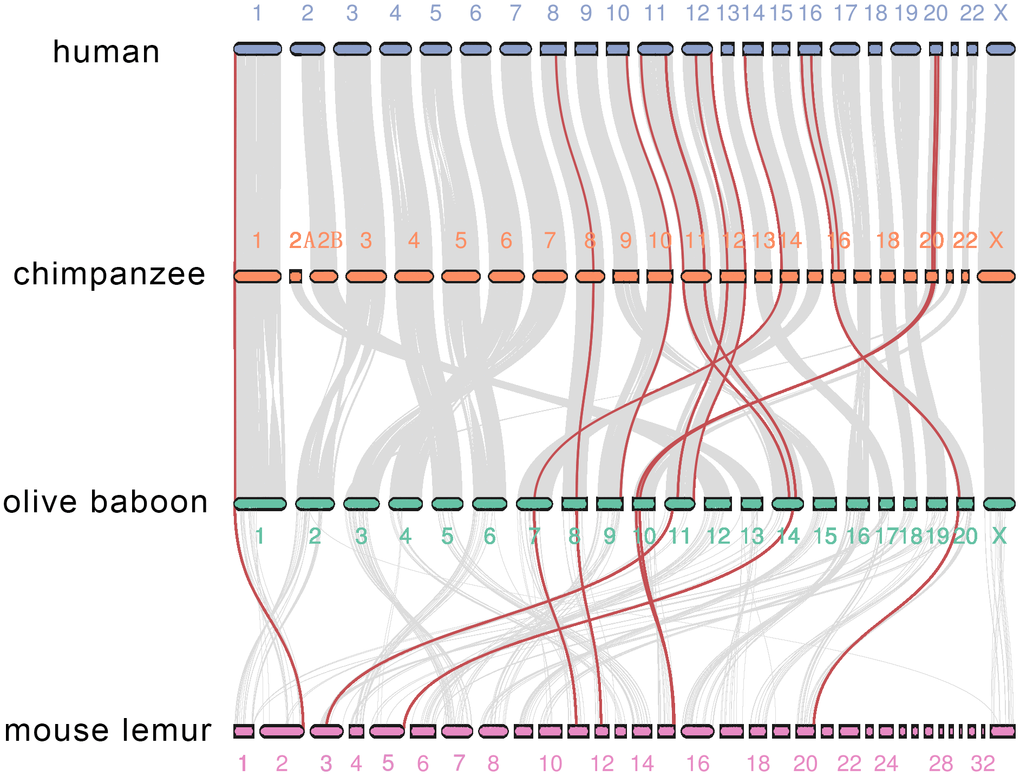
Figure 7.
Co-synteny of the MMP genes across human, chimpanzee, olive baboon and mouse lemur.
Co-synteny clusters are shown as grey curves, and MMPs in the co-synteny clusters are shown in red.