Submit an Article
Navigate
Home
Editorial Board
Editorial Policies
Current Volume
Archive
Scientific Integrity
Publication Ethics Statements
Interviews with Outstanding Authors
Newsroom
Sponsored Conferences
Podcast
Contact
Special Collections
Submit an Article
Online ISSN: 1945-4589
Research Paper
|
Volume 14, Issue 6
|
pp. 2537–2547
Association between serum uric acid and α-klotho protein levels in the middle-aged population
Back to article
Figure 1
(1 of 2)
−
100%
+
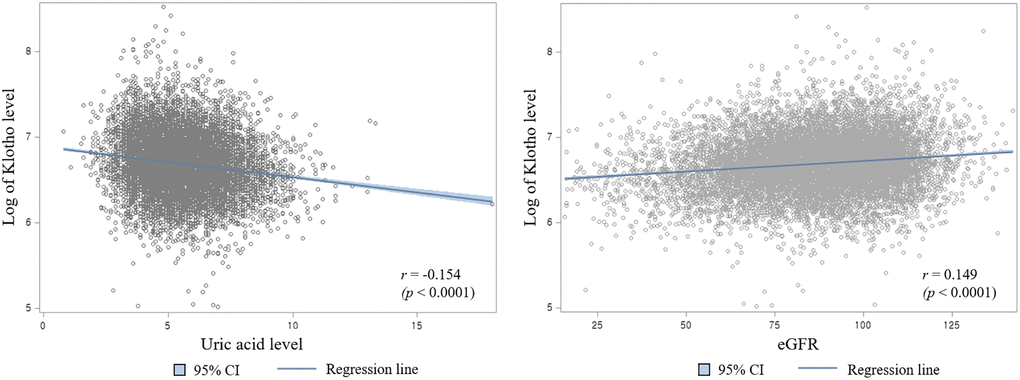
Figure 1.
Scatter plot of log of klotho concentration with serum uric acid levels (Left) and estimated glomerular filtration rate (Right).