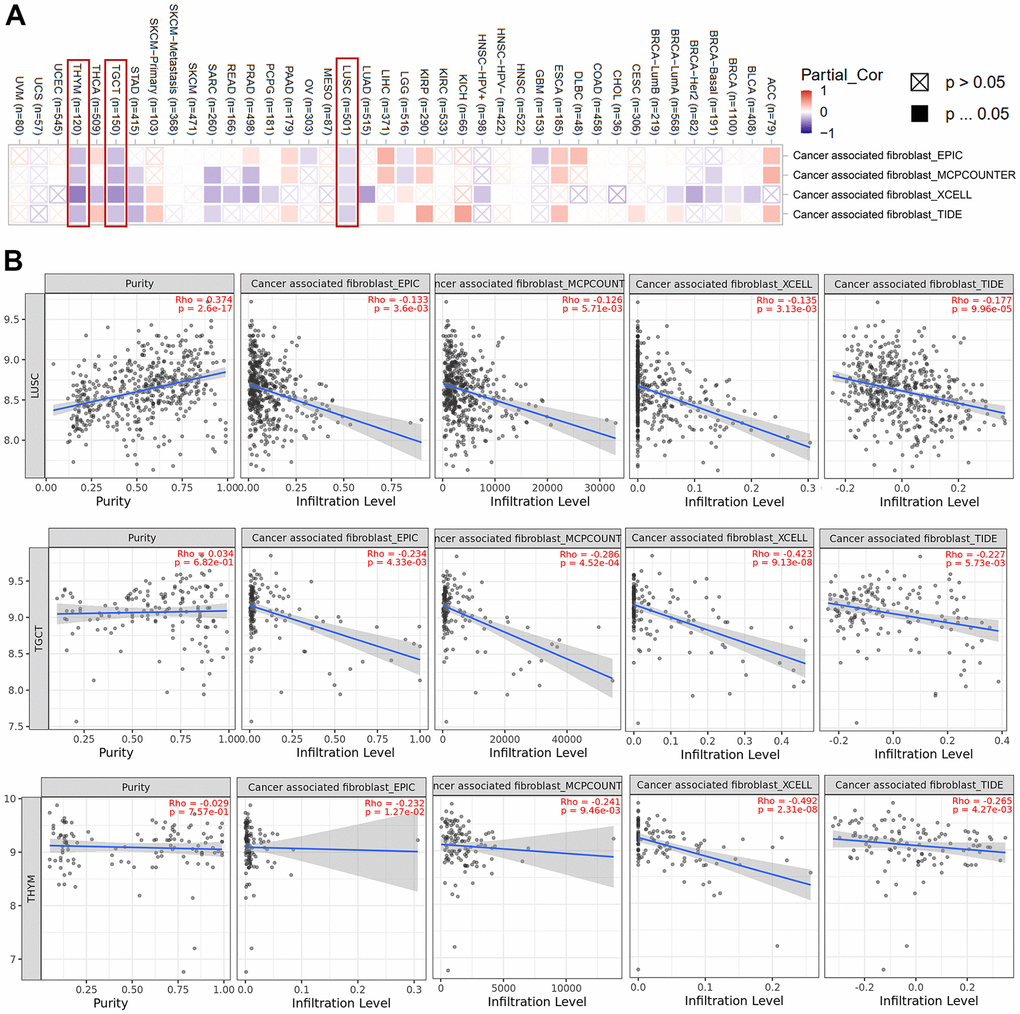
Figure 6.Cancer-associated fibroblasts associated with HNRNPC expression. (A) Heat map showing cancer-associated fibroblasts associated with HNRNPC expression in pan-cancer. (B) HNRNPC expression and cancer-associated fibroblasts estimation value scatter plots in LUSC, TGCT and THYM.