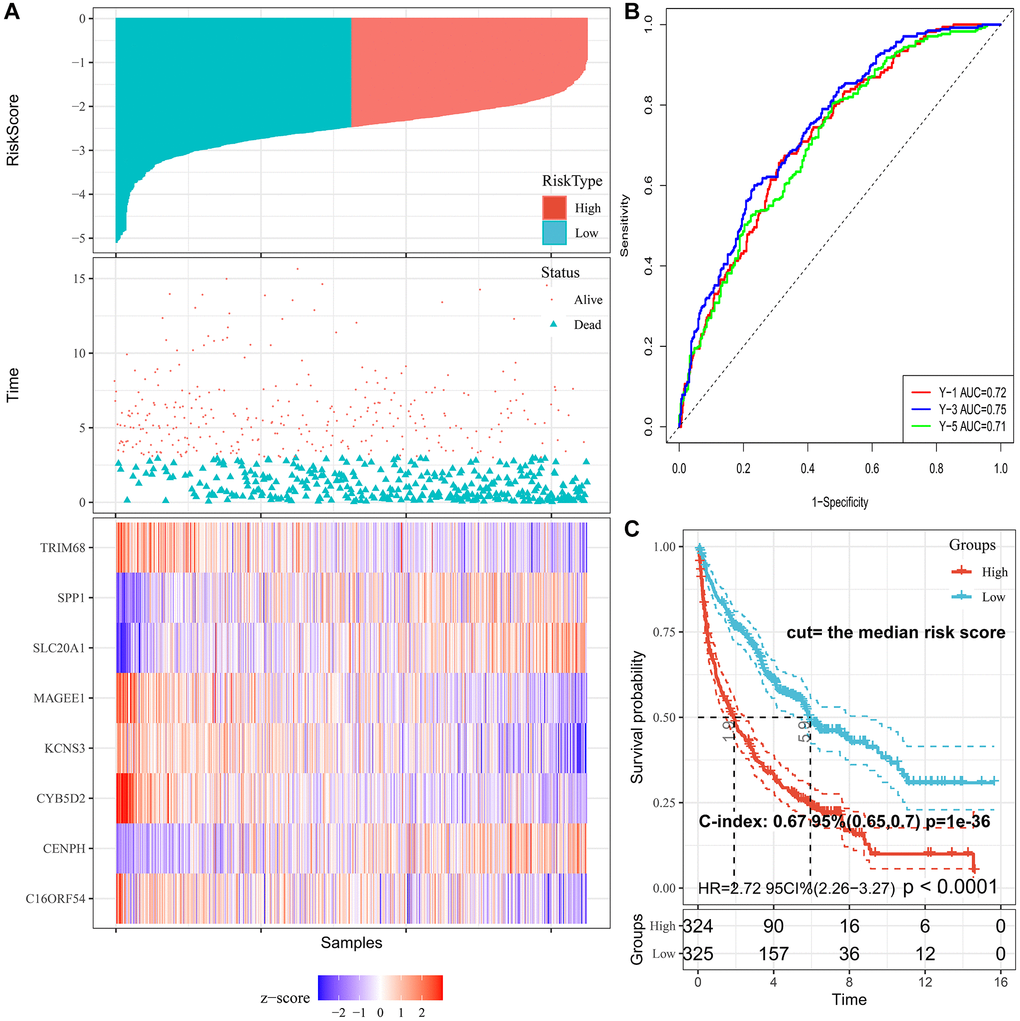
Figure 3.Characteristics of PRS signature in the training cohort. (A) Risk scores distribution, survival status, and gene expression patterns of patients in high- and low-risk groups in the training cohort. (B) Time-dependent ROC analysis for predicting OS. (C) Survival curves and C-index for high- and low-risk groups.