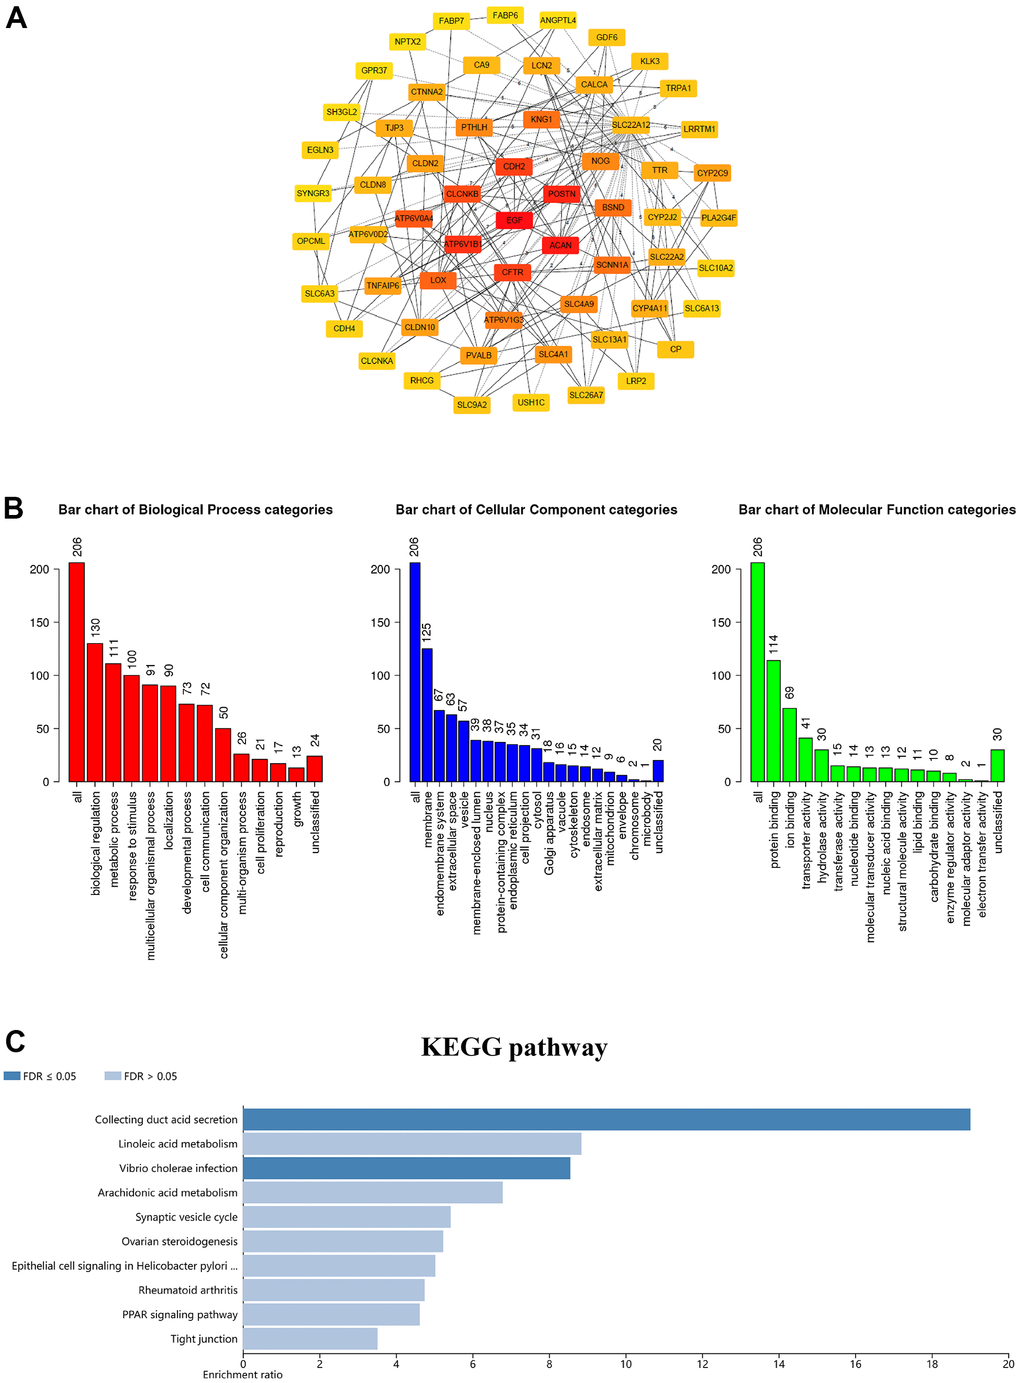
Figure 5.Coexpression network analysis of the GSDM family in ccRCC. (A) The PPI network of GSDM family interaction partners is generated by the cBioPortal and Cytoscape. (B) GO enrichment in biological processes, molecular function and cellular components for the 206 co-expression genes. (C) KEGG pathway enrichment analysis of the 206 co-expression genes.