Submit an Article
Navigate
Home
Editorial Board
Editorial Policies
Current Volume
Archive
Scientific Integrity
Publication Ethics Statements
Interviews with Outstanding Authors
Newsroom
Sponsored Conferences
Podcast
Contact
Special Collections
Submit an Article
Online ISSN: 1945-4589
Research Paper
|
Volume 14, Issue 6
|
pp. 2758–2774
GSDMs are potential therapeutic targets and prognostic biomarkers in clear cell renal cell carcinoma
Back to article
Figure 1
(1 of 7)
−
100%
+
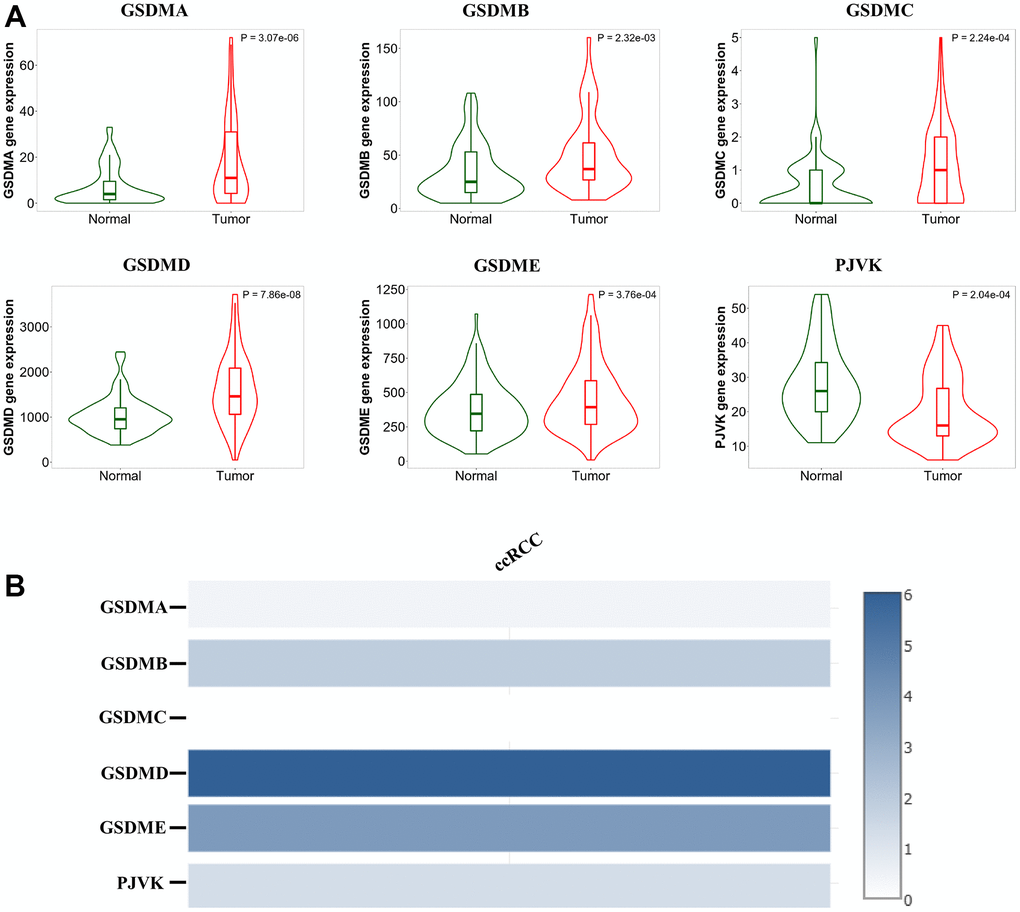
Figure 1.
Analysis of the GSDM family expression levels in ccRCC tissues.
(
A
) The mRNA expression levels of different GSDM family members in ccRCC and normal samples (TNMplot). (
B
) The relative expression of the GSDM family in ccRCC.