Submit an Article
Navigate
Home
Editorial Board
Editorial Policies
Current Volume
Archive
Scientific Integrity
Publication Ethics Statements
Interviews with Outstanding Authors
Newsroom
Sponsored Conferences
Podcast
Contact
Special Collections
Submit an Article
Online ISSN: 1945-4589
Research Paper
|
Volume 14, Issue 6
|
pp. 2736–2747
The association between rs1260326 with the risk of NAFLD and the mediation effect of triglyceride on NAFLD in the elderly Chinese Han population
Back to article
Figure 4
(4 of 4)
−
100%
+
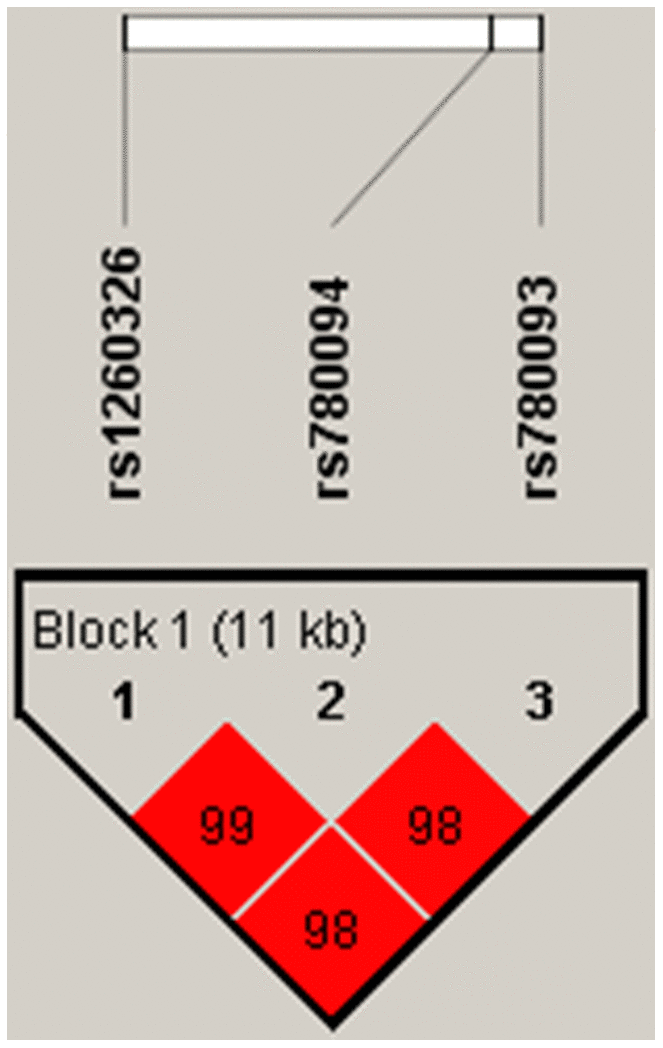
Figure 4.
Linkage disequilibrium plot between SNPs.
The number in each square is r
2
*100 between two SNPs. As shown in the picture above rs1260326-rs780094-rs780093 was identified as a strong block with r
2
>0.8.