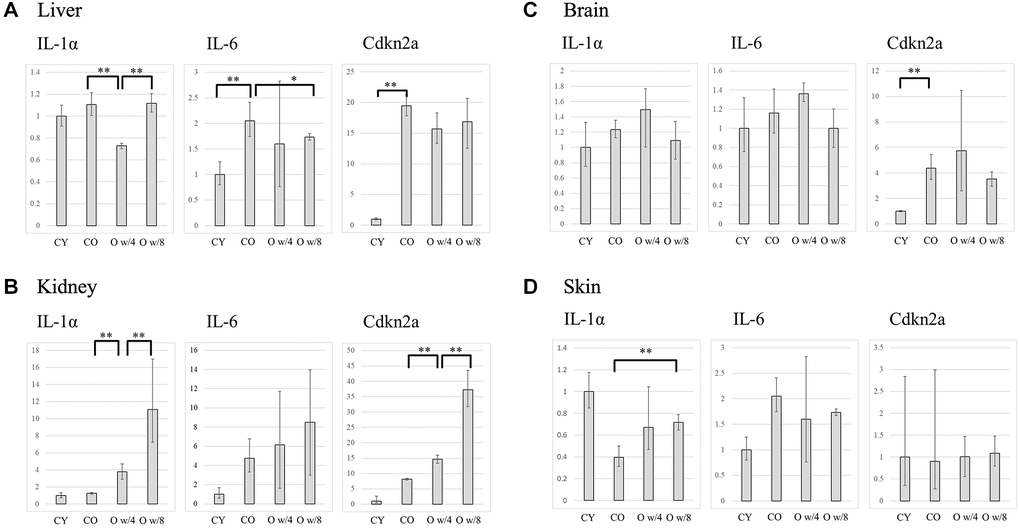
Figure 2.Expression levels of IL-1α, IL-6, and Cdkn2a in the liver (A), kidney (B), brain (C), and skin (D) of the control and parabiosis groups. Abbreviations: CY: control young; CO: control old; O w/4: 67-week-old mice joined with 4-week-old mice; O w/8: 67-week-old mice joined with 8-week-old mice. *P < 0.05, **P < 0.01.