Submit an Article
Navigate
Home
Editorial Board
Editorial Policies
Current Volume
Archive
Scientific Integrity
Publication Ethics Statements
Interviews with Outstanding Authors
Newsroom
Sponsored Conferences
Podcast
Contact
Special Collections
Submit an Article
Online ISSN: 1945-4589
Research Paper
|
Volume 14, Issue 6
|
pp. 2645–2664
Clinical utility of serum fucosylated fraction of alpha-fetoprotein in the diagnostic of hepatocellular carcinoma: a comprehensive analysis with large sample size
Back to article
Figure 2
(2 of 10)
−
100%
+
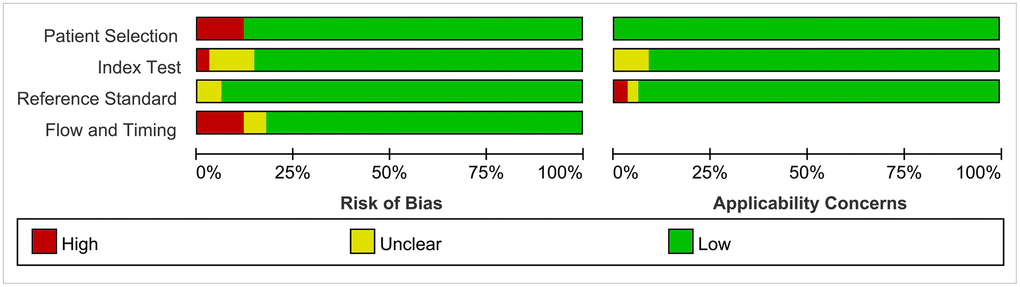
Figure 2.
Risk of bias and applicability concerns graph.