Submit an Article
Navigate
Home
Editorial Board
Editorial Policies
Current Volume
Archive
Scientific Integrity
Publication Ethics Statements
Interviews with Outstanding Authors
Newsroom
Sponsored Conferences
Podcast
Contact
Special Collections
Submit an Article
Online ISSN: 1945-4589
Research Paper
|
Volume 14, Issue 5
|
pp. 2418–2431
miRNA-29a inhibits atherosclerotic plaque formation by mediating macrophage autophagy via PI3K/AKT/mTOR pathway
Back to article
Figure 2
(2 of 7)
−
100%
+
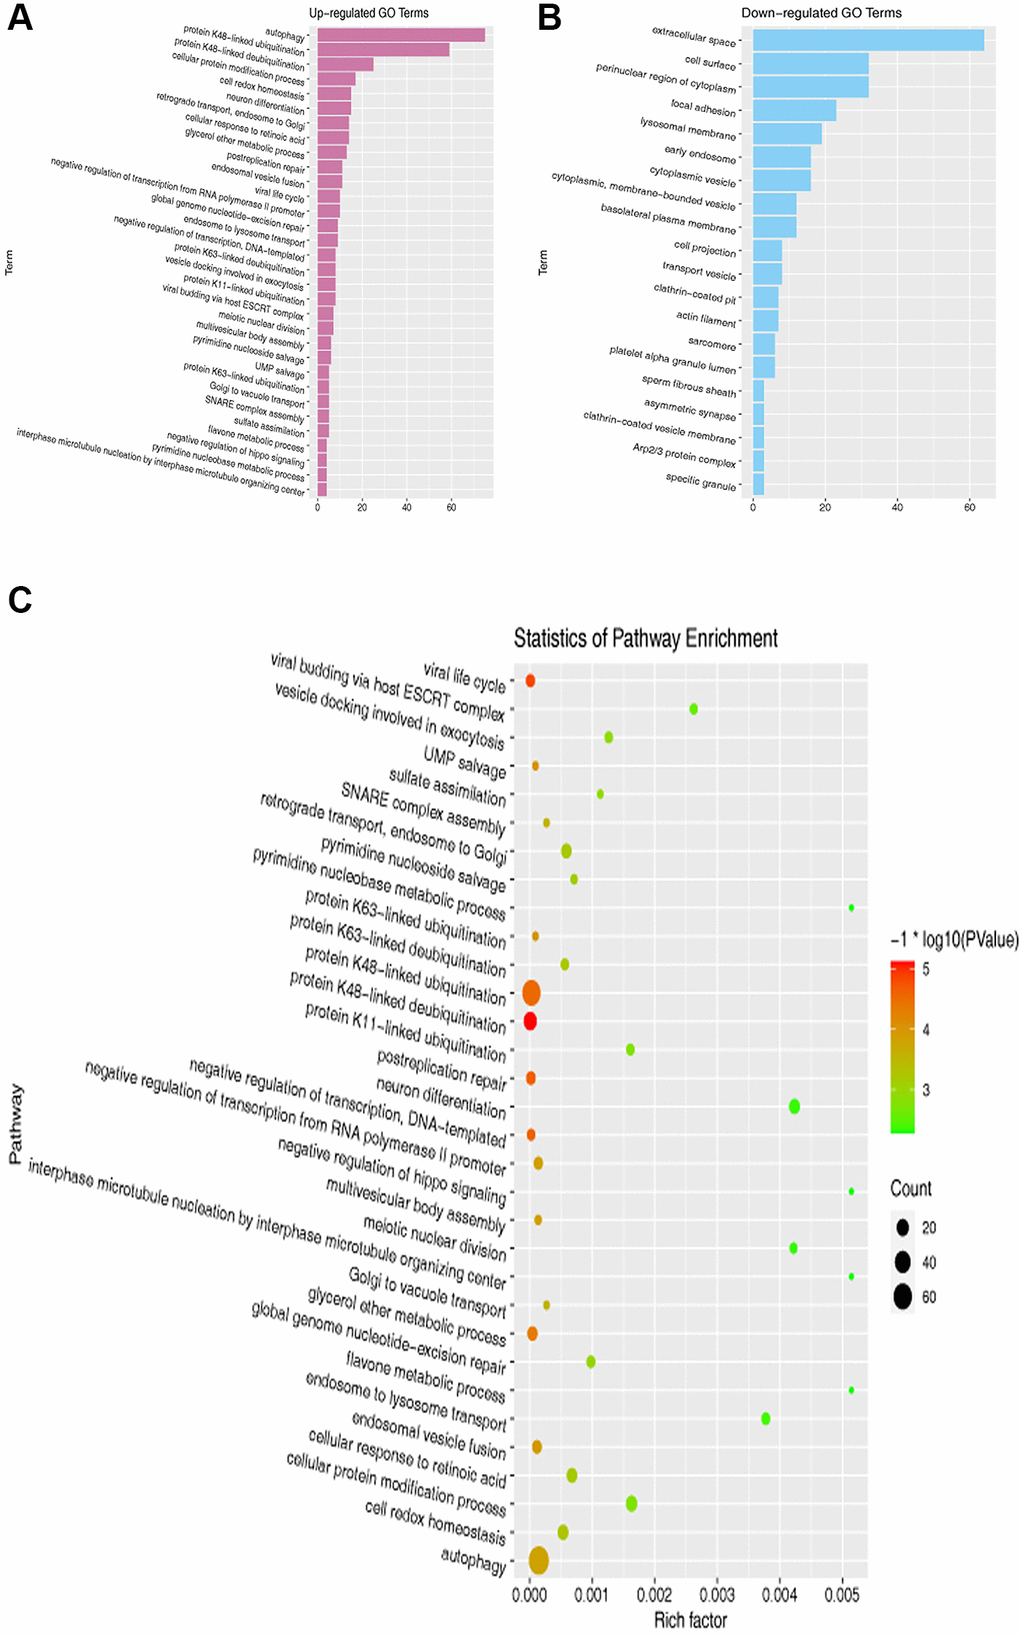
Figure 2.
GO and KEGG pathway enrichment analyses of DEGs.
(
A
,
B
) GO enrichment analysis of overlapping DEGs. (
C
) KEGG pathway enrichment analysis of overlapping DEGs.