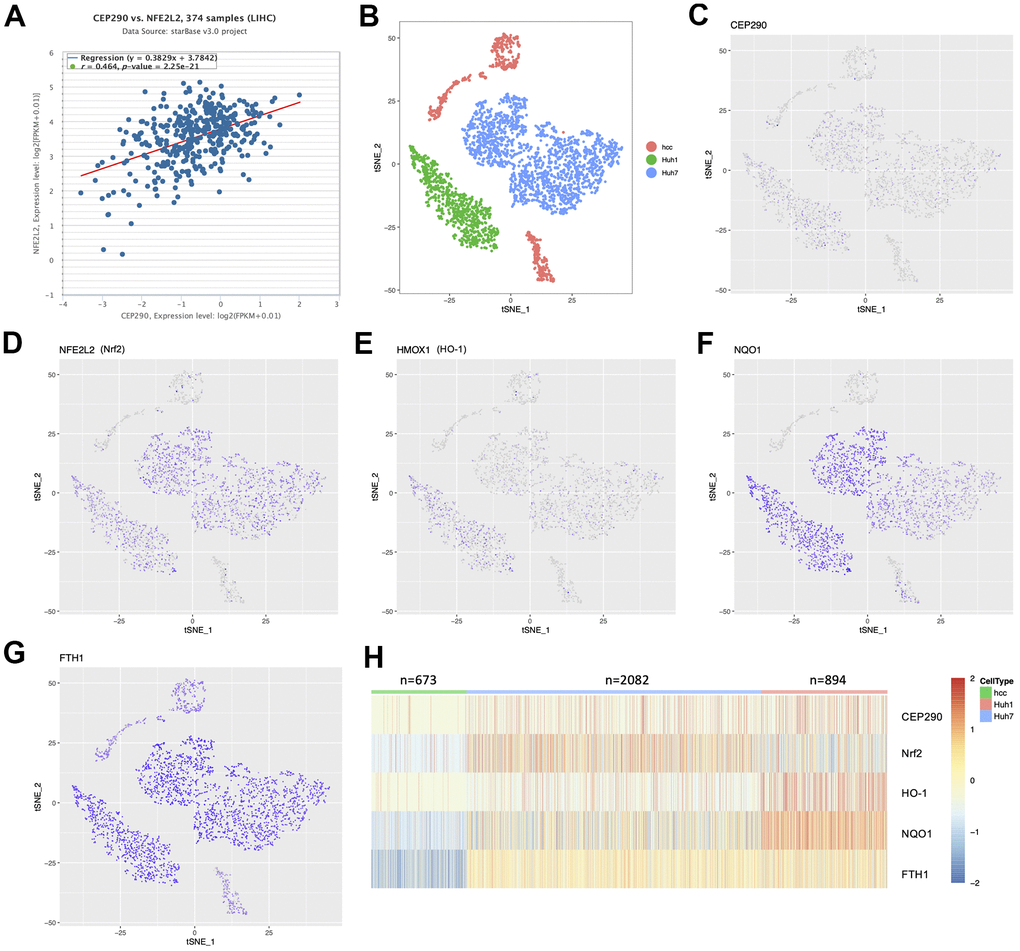
Figure 6.The expression distribution between CEP290 and Nrf2 pathway members in single-cell profiling. (A) Co-expression correlation analysis using the TCGA-LIHC RNA-Seq cohort (n=374). (B) t-SNE map shows three liver cancer cell classes. Each dot represents one cell. (C–H) Profile of target expression (scRNA-Seq) based on the t-SNE plot from Figure 6B.