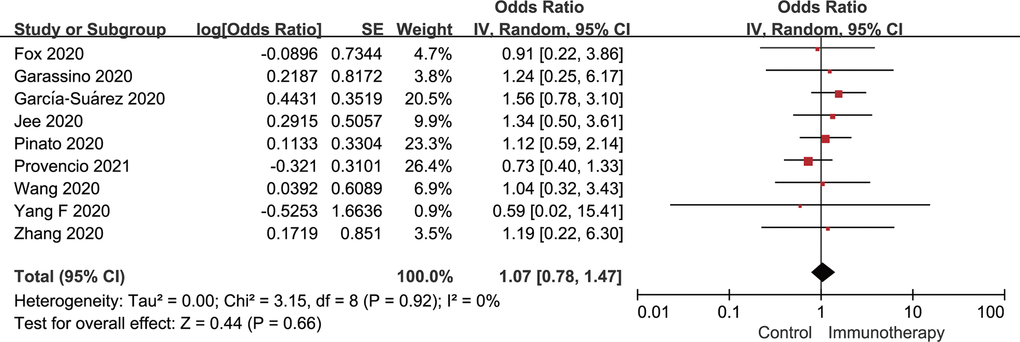
Figure 4.Forest plot of the univariate analysis for the association between active immunotherapy and severe/critical disease rate. CI, confidence interval; IV, inverse variance; SE, standard error.
Figure 4 — Association of active immunotherapy with outcomes in cancer patients with COVID-19: a systematic review and meta-analysis | Aging