Submit an Article
Navigate
Home
Editorial Board
Editorial Policies
Current Volume
Archive
Scientific Integrity
Publication Ethics Statements
Interviews with Outstanding Authors
Newsroom
Sponsored Conferences
Podcast
Contact
Special Collections
Submit an Article
Online ISSN: 1945-4589
Research Paper
|
Volume 14, Issue 5
|
pp. 2320–2334
Polo-like kinases as potential targets and PLK2 as a novel biomarker for the prognosis of human glioblastoma
Back to article
Figure 7
(7 of 9)
−
100%
+
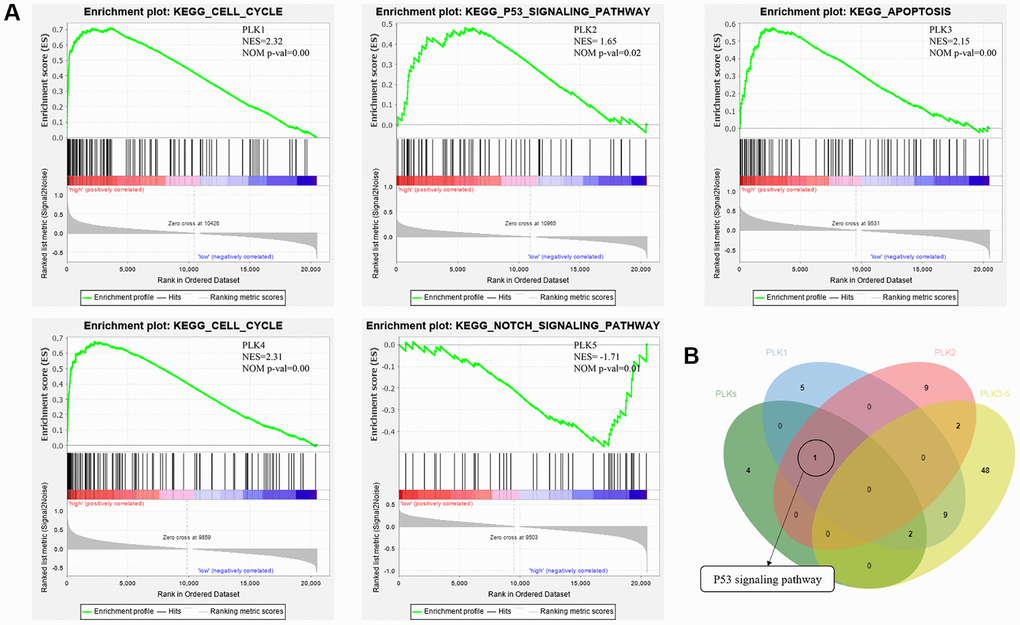
Figure 7.
(
A
) Functional analysis of PLKs in TCGA cohort using GSEA. (
B
) Overlapping KEGG pathways between PLKs’ network and GSEA’s results.
Figure 7 — Polo-like kinases as potential targets and PLK2 as a novel biomarker for the prognosis of human glioblastoma | Aging