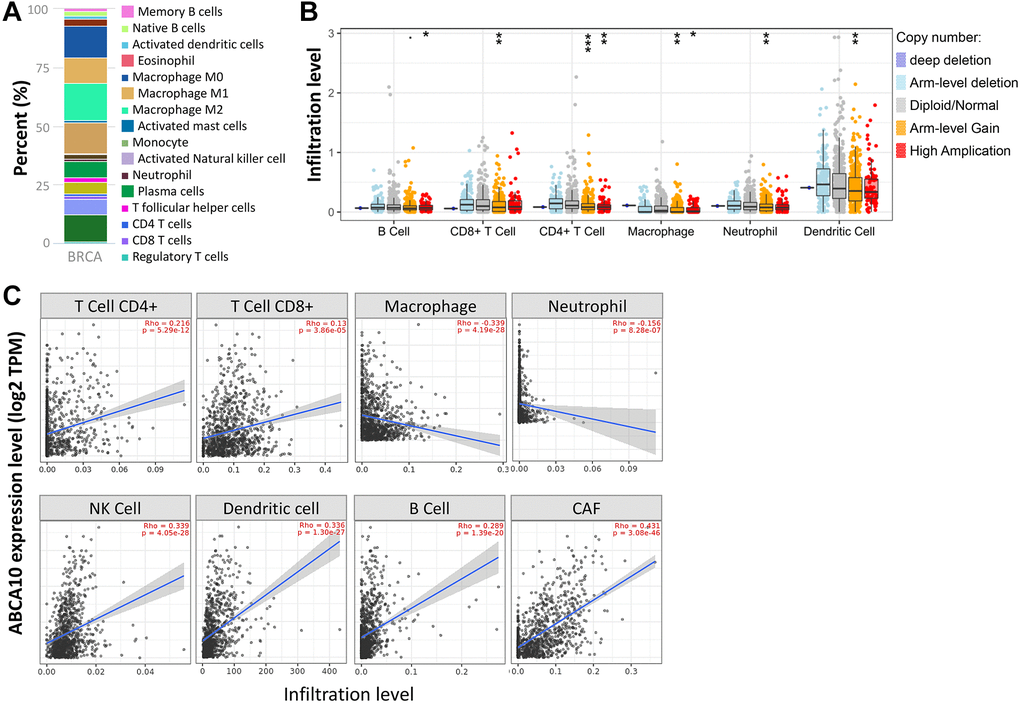
Figure 8.Correlation of ABCA10 expression with immune infiltration level in BRCA. (A) Immune cell bars show the expression of the ABCA10 gene. (B) The infiltration level of various immune cells under different copy numbers of ABCA10 in BRCA. (C) The correlation between ABCA10 expression level and immune infiltration. *P < 0.05, **P < 0.01, ***P < 0.001.