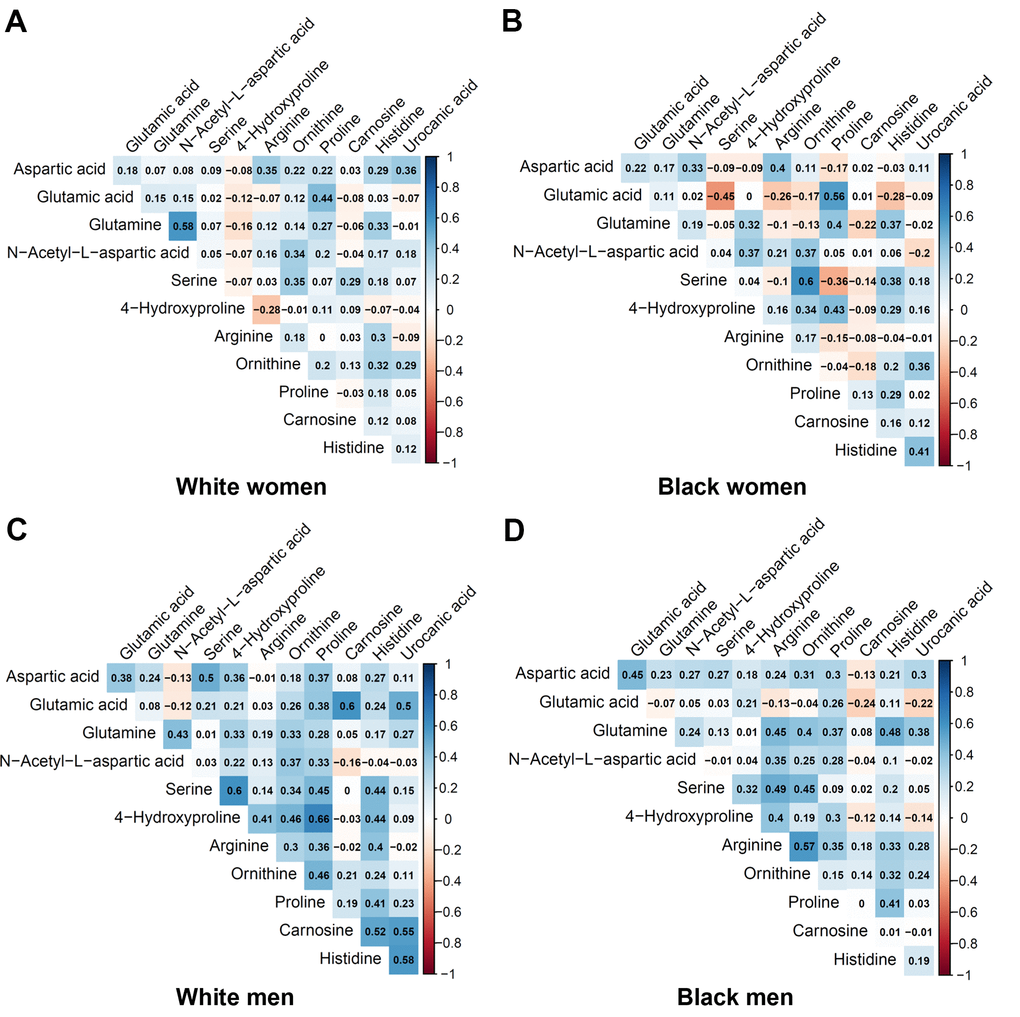
Figure 2.Pairwise correlation coefficients among the metabolites in the race-sex subgroups of the validation cohort. (A) White women. (B) Black women. (C) White men. (D) Black men.
Figure 2 — Pathway-based metabolomics study of sarcopenia-related traits in two US cohorts | Aging