Submit an Article
Navigate
Home
Editorial Board
Editorial Policies
Current Volume
Archive
Scientific Integrity
Publication Ethics Statements
Interviews with Outstanding Authors
Newsroom
Sponsored Conferences
Podcast
Contact
Special Collections
Submit an Article
Online ISSN: 1945-4589
Research Paper
|
Volume 14, Issue 3
|
pp. 1529–1548
Construction and validation of a prognostic risk model of angiogenesis factors in skin cutaneous melanoma
Back to article
Figure 13
(13 of 14)
−
100%
+
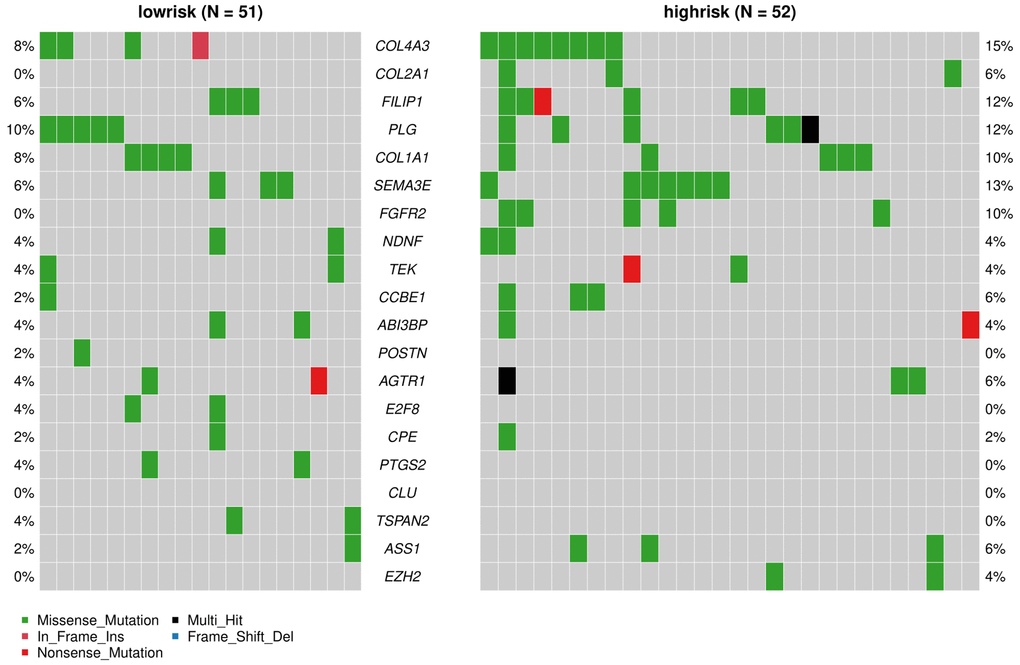
Figure 13.
Analyses of somatic mutation profiles in melanoma samples.
Waterfall plot of detailed mutation information of the top 20 genes in the high- and low-risk groups, with various color annotations to distinguish different mutation types.