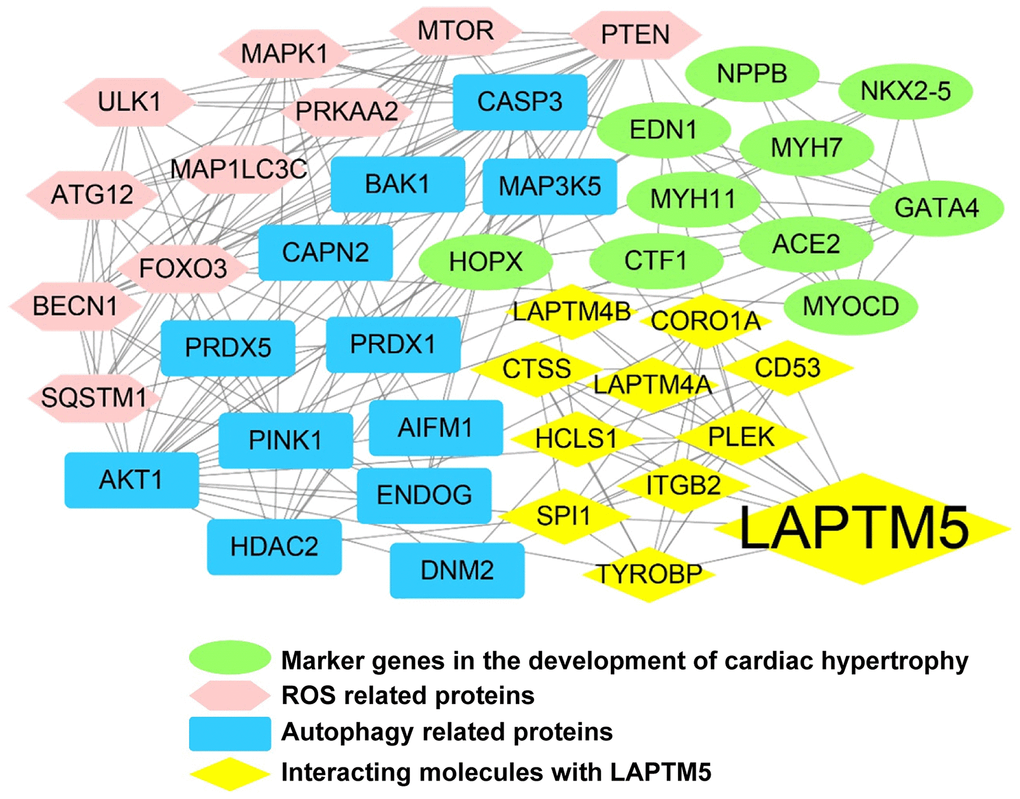
Figure 9.LAPTM5-mediated PPI network construction. The node color reflects the source of the proteins. Yellow represents the proteins with strong interactions (score >0.80) with LAPTM5, originating from the STRING database. Brown represents altered ROS-related proteins, blue indicates distinct autophagy-related proteins, and green denotes known key molecules modulated in LVH.