Submit an Article
Navigate
Home
Editorial Board
Editorial Policies
Current Volume
Archive
Scientific Integrity
Publication Ethics Statements
Interviews with Outstanding Authors
Newsroom
Sponsored Conferences
Podcast
Contact
Special Collections
Submit an Article
Online ISSN: 1945-4589
Research Paper
|
Volume 14, Issue 3
|
pp. 1508–1528
Comprehensive bioinformatics analysis identifies LAPTM5 as a potential blood biomarker for hypertensive patients with left ventricular hypertrophy
Back to article
Figure 4
(4 of 11)
−
100%
+
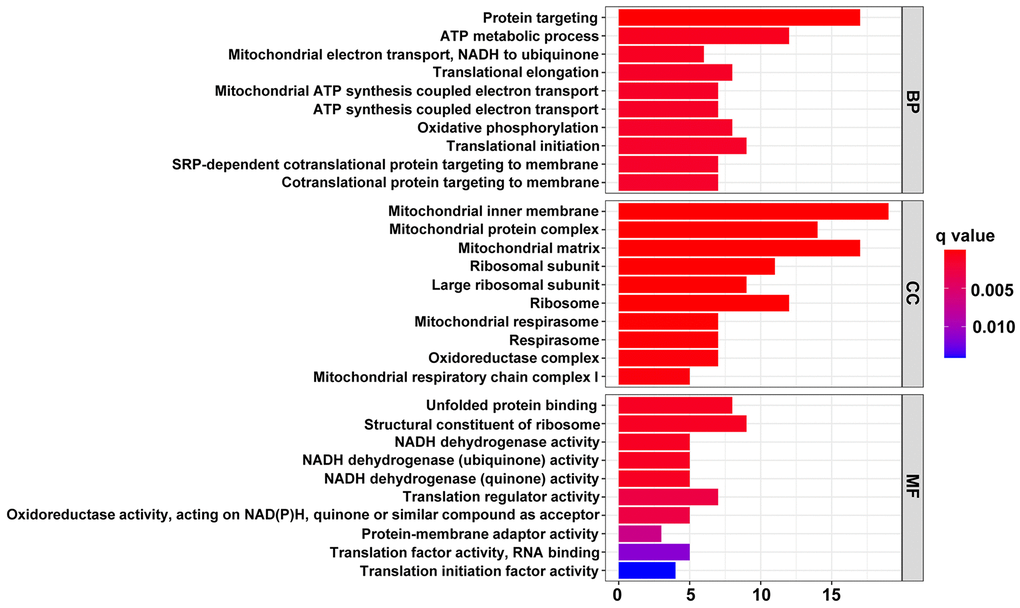
Figure 4.
The top 10 significantly enriched terms in GO enrichment analysis.
The horizontal axis indicates the number of genes enriched in this term. The term color denotes the degree of enrichment.