Submit an Article
Navigate
Home
Editorial Board
Editorial Policies
Current Volume
Archive
Scientific Integrity
Publication Ethics Statements
Interviews with Outstanding Authors
Newsroom
Sponsored Conferences
Podcast
Contact
Special Collections
Submit an Article
Online ISSN: 1945-4589
Research Paper
|
Volume 14, Issue 3
|
pp. 1473–1491
Identification of an EMT-related lncRNA signature and LINC01116 as an immune-related oncogene in hepatocellular carcinoma
Back to article
Figure 5
(5 of 10)
−
100%
+
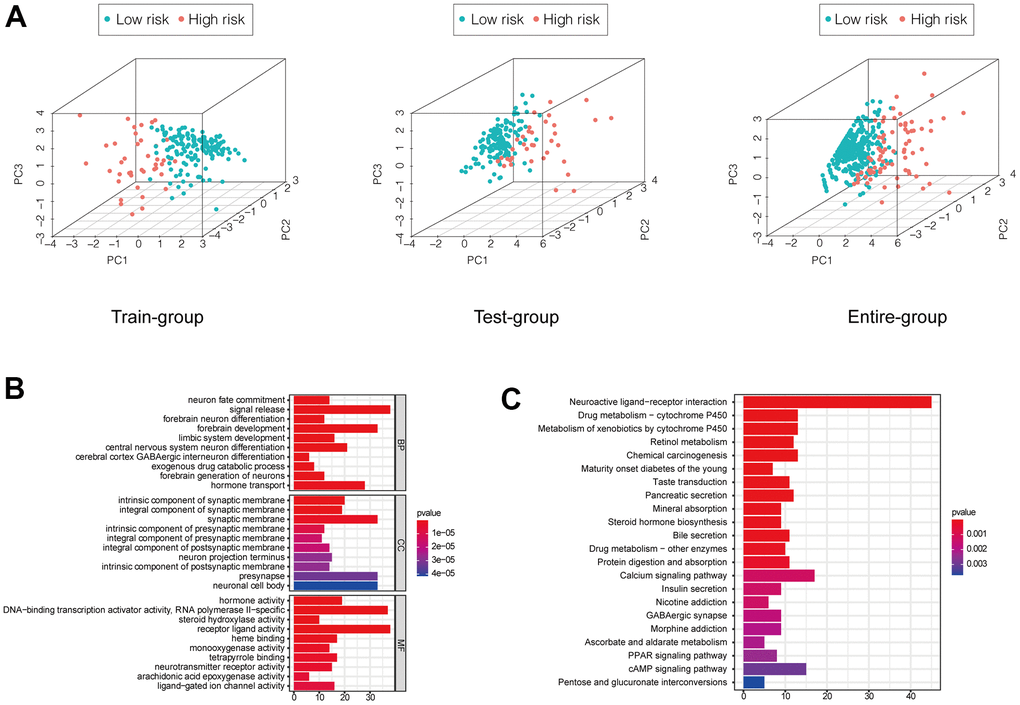
Figure 5.
(
A
) PCA showed a scattered distribution of patients in each group. (
B
,
C
) GO and KEGG analysis of DEGs between high and low-risk groups of the entire group.