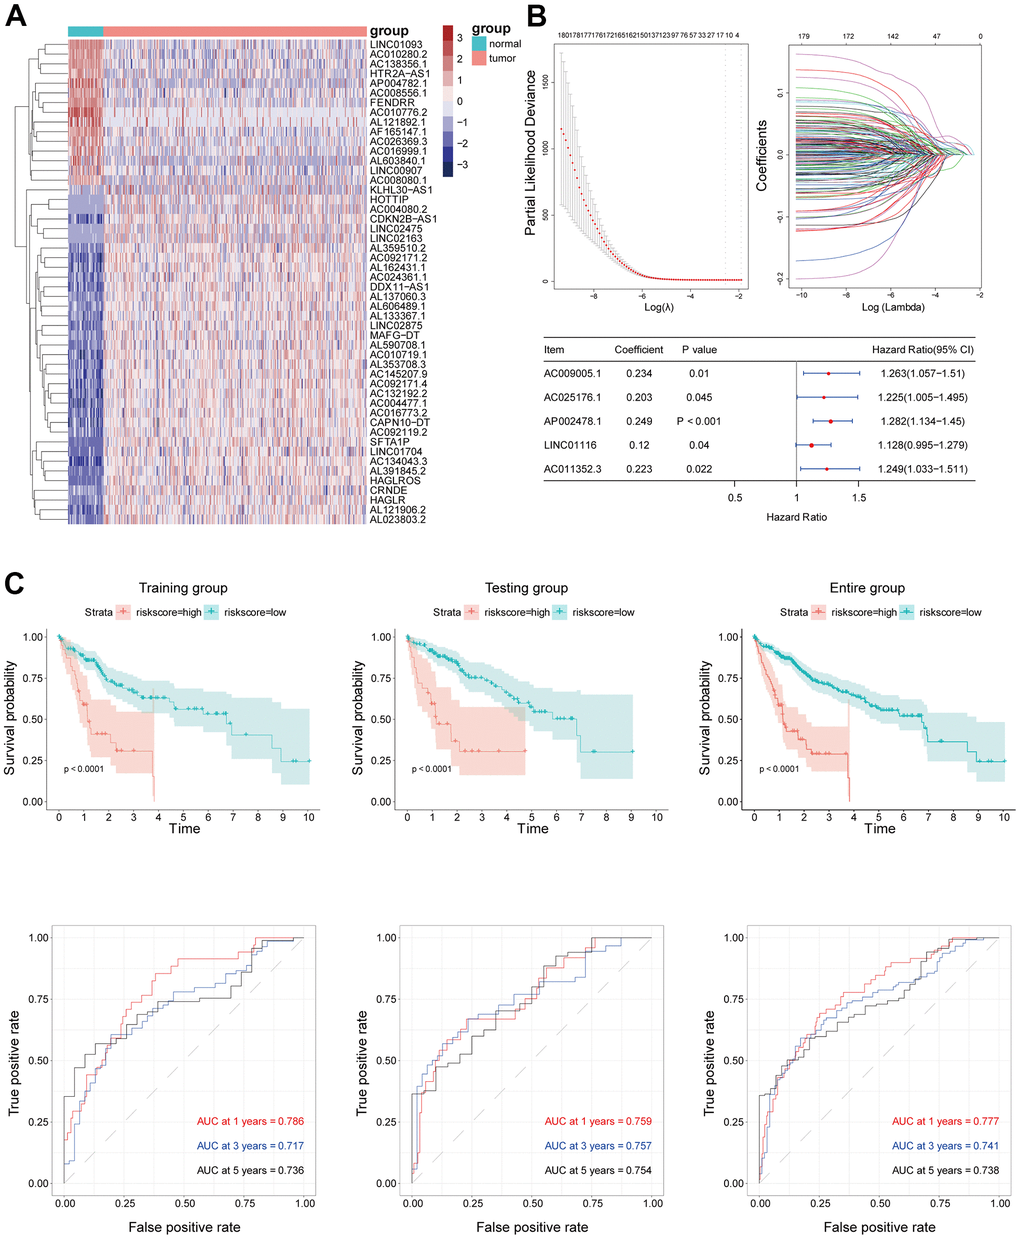
Figure 2.(A) The top 50 of both up- and down-regulated DElncRNAs with the most significant differences were represented by the heatmap. (B) EMT-related lncRNA signature was established by Univariate Cox regression, LASSO and Multivariate Cox regression analysis. (C) Kaplan–Meier survival analysis suggested a lower OS in high-risk groups. ROC curve showed good accuracy of this signature in predicting OS of 1, 3 and 5 years.