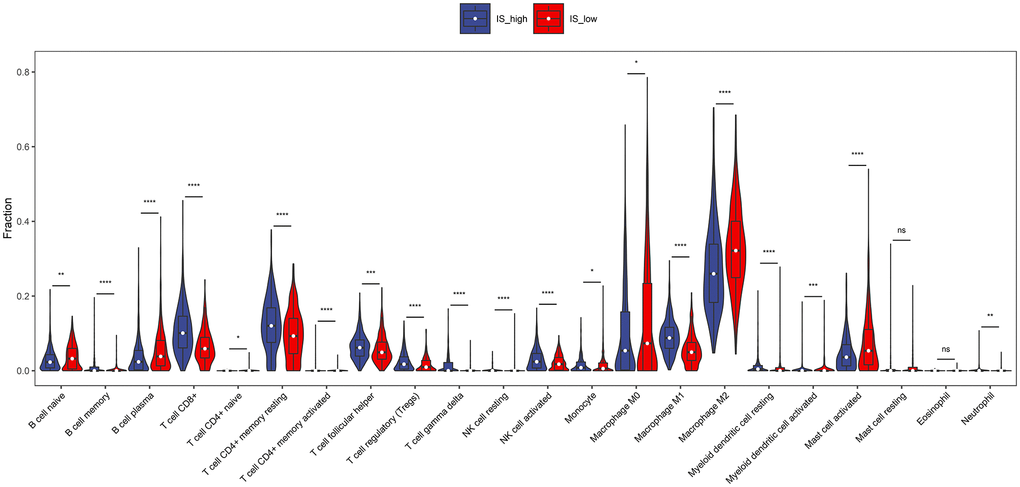
Figure 3.The proportions of TIICs between high immune score group and low immune score group. Difference of immune cell concentration between low-risk group and high-risk group. Red represents high-risk group while blue represents low-risk group.
Figure 3 — Identification of immune-related cells and genes in the breast invasive carcinoma microenvironment | Aging